New Order
New Order Panel
The New Order panel is designed for placing market and conditional orders.
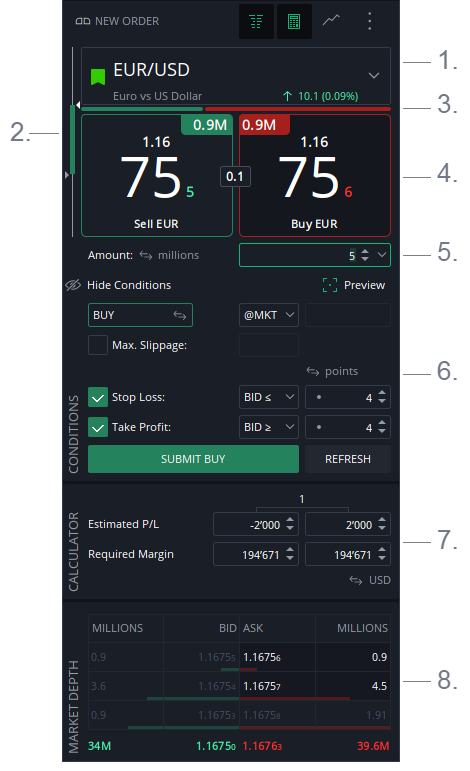
- Instrument Selector
- Day's Range
- Sentiment Index
- Price Tickers
- Amount
- Conditions
- Calculator
- Market Depth
Appearance
The New Order panel is available in the following forms:
- Left Side Area — Embedded in the main window on the left side
- Detached window — Can be opened as a floating window. Up to 5 detached New Order windows can be opened simultaneously, each for a different instrument. The window title bar updates to reflect the current direction and instrument (e.g. BUY EUR/USD)
- Chart trading dialog — A compact version that can be opened from the chart context menu
- Keyboard shortcut — Press F9 to open a detached New Order window
- Instruments table — Double-click any row in the Instruments table to open a detached New Order window for that instrument
The detached window toolbar provides the following controls:
- Pin — Keeps the window on top of other windows
- Settings — Opens the panel configuration
- List icon —Toggles the Market Depth component visibility
- Calculator icon — Toggles the Calculator component visibility
- Chart icon — Toggles the Chart component visibility
- Menu — Opens the context menu
1. Instrument Selector
Click the instrument name to enter edit mode and search for an instrument.
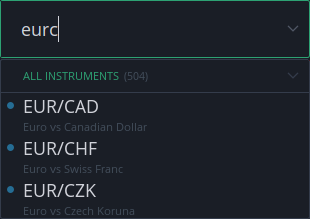
Instruments can be searched by:
- Symbol
- Description
- Group
Results are filtered in real time as you type. Each result shows the instrument symbol and its full description below.
Click the arrow to open the full instrument list. Since the number of available instruments is large, they are organized into the following groups:
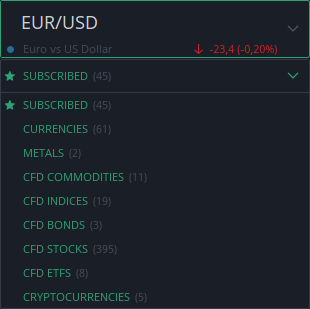
- Subscribed — Your subscribed instruments (shown at the top)
- Currencies
- Metals
- CFD Commodities
- CFD Indices
- CFD Bonds
- CFD Stocks
- CFD ETFs
- Cryptocurrencies
Hover over an instrument in the list to view its trading session information:
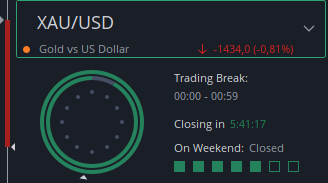
- The inner circle represents AM trading hours
- The outer circle represents PM trading hours
- The countdown shows the time remaining until the next market break (if the market is open) or until market opening (if the market is closed)
- Squares indicate whether the market is open on weekends
- A small triangle marks the current time
2. Day's Range
The candlestick on the left side of the panel displays the daily price range and change.
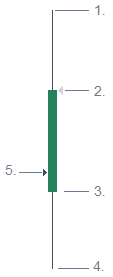
- High ASK
- Current BID (shown as a triangle)
- Open BID of the current day
- Low BID
- Triangle on the left — previous day's closing BID
Note: All displayed data use the time zone configured under Preferences → General.
Hover over the candlestick to view detailed daily statistics:
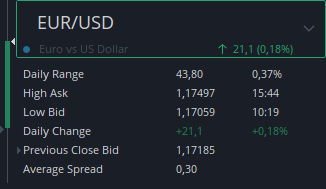
- Daily Range — difference between High ASK and Low BID, shown in points and as a percentage of price
- High ASK — price and time of the daily high
- Low BID — price and time of the daily low
- Daily Change — difference between the current BID and the previous day's closing BID
- Previous Close BID — previous day's closing BID price
- Average Spread — see below
Note: The Day's Range can be hidden in the New Order panel settings.
Average Spread
The Average Spread is the historical BID/ASK spread calculated from the previous week's data. Hours immediately before and after settlement are excluded, as spreads are typically wider during periods of low liquidity.
The value is updated once a week at the start of each Monday (00:00 EET).
The Average Spread can be used as a default trading value when setting order distances, as an alternative to specifying distances in points. Default trading values can be configured under Preferences → Trading.
3. Sentiment Index
The Sentiment Index is a proprietary indicator showing the ratio of liquidity consumers to liquidity providers.
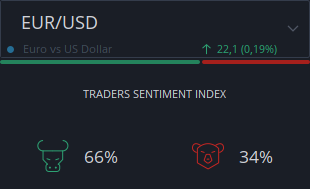
Hover over the index to view the underlying numbers:
- Bullish % — percentage of liquidity consumers
- Bearish % — percentage of liquidity providers
4. Price Tickers
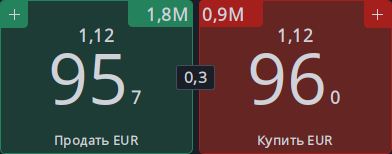
The Price Tickers display the current Best BID and Best ASK prices. The number between them shows the current market spread — the difference between Best BID and Best ASK.
The available liquidity at the best price is shown above each ticker.
Right-click on the Price Tickers to change their display settings.
Placing market orders via Price Tickers:
- Clicking the Best BID ticker (left) sends a market SELL order for the amount set in the Amount field
- Clicking the Best ASK ticker (right) sends a market BUY order for the amount set in the Amount field
Placing BID or OFFER orders:
To place a BID or OFFER order, click the + buttons located in the top-left and top-right corners of the Price Tickers area. This opens a dedicated order dialog.
Warning: The conditions set in the Conditions panel are NOT applied when placing a market order by clicking the Price Tickers.
Note: It is possible to automatically attach a Stop Loss and Take Profit to positions opened via the Price Tickers. The distances for both are set under Preferences → Trading → Default Trading Values. To enable this feature, activate "Apply default Stop Loss" and "Apply default Take Profit" for Market type orders under Preferences → Trading → Trading Settings.
5. Amount
The amount set in this field is used when:
- Clicking the Price Tickers to send a market order
- Clicking Submit to send a conditional order
The unit of measurement is displayed next to the Amount label and depends on the instrument type:
- Forex instruments — units, thousands or millions
- CFD instruments — contracts
Hover over the amount field to display detailed trading information for the selected amount:
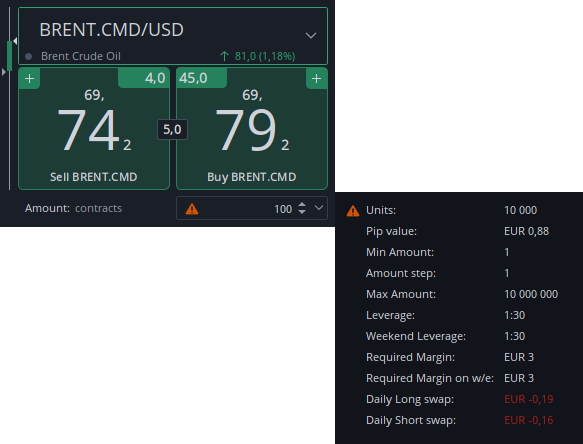
- Units — total number of units for the selected amount
- Pip value — value of one pip in the account currency
- Min Amount — minimum allowed order size
- Amount step — minimum increment for the amount field
- Max Amount — maximum allowed order size
- Leverage — current leverage for the instrument
- Weekend Leverage — leverage applied over the weekend
- Required Margin — margin required for the selected amount
- Required Margin on w/e — margin required over the weekend
- Daily Long swap — overnight financing cost for long positions
- Daily Short swap — overnight financing cost for short positions
Warning: If a yellow triangle appears on the amount field, the CFD instrument has an amount multiplier — meaning each contract contains multiple units. The total amount in units is displayed in the tooltip.
Example: One contract of BRENT.CMD contains 100 units (barrels). The price is quoted per unit, so the multiplier directly affects the resulting profit or loss.
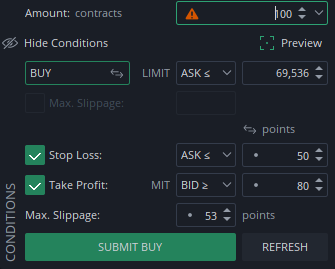
6. Conditions
The Conditions section provides additional settings for market and pending orders. Click Show Conditions to expand this section.
Warning: The conditions set in the Conditions panel are NOT applied when placing a market order by clicking the Price Tickers.
Preview
Enable Preview to display the order line(s) on any chart showing the same instrument.

Order Direction and Type
- Direction — Select BUY or SELL
- Order type — Select the order execution type (e.g. @MKT, LIMIT, and others)
- Max. Slippage — Maximum allowed price deviation from the requested price
Price Format
Stop Loss and Take Profit prices can be displayed in one of the following formats:
- Points — a dot is shown in the field
- Price — the absolute price level
- % of price — a % symbol is shown in the field
Stop Loss
Stop Loss can be enabled or disabled independently of Take Profit. When enabled, the following trigger types are available for LONG positions:
- BID ≤ (STOP) — triggered when BID price falls to or below the set level
- ASK ≤ (STOP) — triggered when ASK price falls to or below the set level
- BID ≤ (TRAILING STOP) — a dynamic stop that follows the price and triggers when BID falls by the set distance from its peak
- ASK ≤ (TRAILING STOP) — a dynamic stop that follows the price and triggers when ASK falls by the set distance from its peak
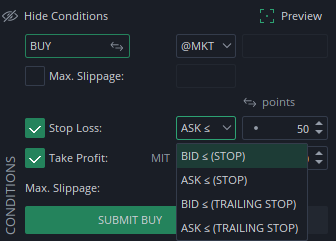
Note: Using the opposite trigger side (e.g. ASK for a BUY order) helps prevent accidental execution on wide spreads during periods of low liquidity. The opposite trigger side can be set automatically via Preferences → Trading Settings. This option is disabled by default.
Take Profit
Take Profit can be enabled or disabled independently of Stop Loss. To increase the likelihood of a Take Profit order being filled, it can be configured as a Market If Touched (MIT) order:
- The order is executed as a market order when the Take Profit price is reached
- Max Slippage must be set to limit the execution price range. This field appears automatically when MIT is enabled
- If the order cannot be filled within the specified price range, it will remain active at the new limit price
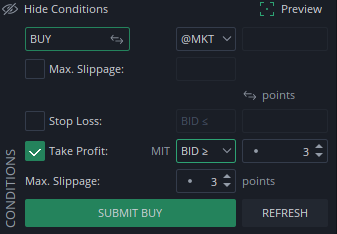
Note: Take Profit orders can be automatically set as MIT via Preferences → Trading Settings. This option is disabled by default.
Submit and Refresh
- Submit — Places the order with the current settings
- Refresh — Resets the values of fields that depend on the current BID/ASK price, such as Stop Loss and Take Profit levels
7. Calculator
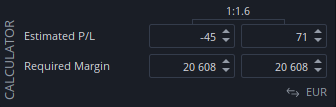
The Calculator displays estimated trading costs and potential outcomes before placing an order.
Estimated P/L is shown when:
- Values for Stop Loss and/or Take Profit are set in the Conditions panel, or
- Stop Loss or Take Profit is enabled for market orders in Preferences
The values are shown even if the Conditions panel is collapsed.
The Risk/Reward ratio (shown as 1:X) is displayed at the top of the Calculator when both Stop Loss and Take Profit are enabled.
Required Margin (both regular and weekend) is calculated based on the amount set in the Amount field and the leverage of the selected instrument.
The display format can be switched between account currency and % of equity.
Note: The Estimated P/L fields are editable. Changing these values directly in the Calculator affects only the Amount field.
8. Market Depth

The Market Depth table displays the available liquidity for the selected instrument. Up to 10 price levels can be shown on each side — BID and ASK.
Right-click to select how many price levels to display.
Each row displays:
- Available liquidity at that price level
- A visual bar showing the relative size of liquidity at that level compared to other levels
When hovering over the Best BID or Best ASK buttons, relevant rows in the table are highlighted, indicating the depth required to execute the amount specified in the Amount field.
Warning: The highlighted depth is indicative only and may differ from the actual execution price due to constantly changing market liquidity and potential price slippage.
Totals are displayed at the bottom of the table and show:
- The sum of BID and ASK amounts across all displayed levels
- The average price across all 10 levels
The unit of measurement depends on the instrument type:
- CFD instruments — displayed in contracts
- Forex instruments — displayed in units, thousands or millions