Line Studies
The trading platform provides a wide array of line study tools and graphical objects for technical analysis which can be accessed via the icon bar above the chart.
- Price Marker (1)
- Time Marker (2)
- Drawings (3)
- Retracements (4)
- Overlay (5)
- Chart Layers (6)
- OHLC (7)
- Cursor Pointer (8)
To add an object, click on the respective icon or follow the instructions for the specific object below. Graphical objects can be moved, modified, edited and removed with a few simple mouse clicks.
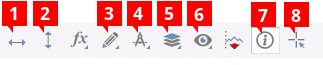
Price Marker 
Draws a horizontal line on the chart showing the price level.
Click on the icon and point the mouse on the chart. When you have set the desired price level, click again. After a Price Marker has been added to the chart, you may set a specific price level by right-clicking the marker and selecting Edit Coordinates.
Time Marker 
Draws a vertical line on the chart showing the time period.
Click on the icon and point the mouse on the chart. When you have set the desired time, click again. After a Time Marker has been added to the chart, you may set a specific point in time by right-clicking the marker and selecting Edit Coordinates.
Drawings 
The trading platforms offers the following graphical objects:
- Percent Lines
- Channel Lines
- Poly Line
- Short Line
- Long Line
- Ray Line
- Rectangle
- Triangle
- Ellipse
- Signal Up
- Signal Down
- Text
- Screen Label
- Periods
- Candlestick
To draw an object:
- Click on the Drawings icon.
- Select one of the objects from the menu.
- Click, drag and click again on the chart to set the coordinates. Certain objects may require more coordinates to be set up.
Retracements 
The trading platform offers the following retracements:
- Fibonacci Fan Lines
- Fibonacci Fan Arcs
- Fibonacci Retracements
- Fibonacci Time Zones
- Fibonacci Time Zones %
- Fibonacci Expansion
- Gann Angle
- Gann Periods
- Andrew's Pitchfork
To add a Retracement:
- Click on the Retracement icon.
- Select one of the retracements from the menu.
- Click, drag and click again on the chart to set the coordinates. Certain objects may require more coordinates to be set up.
Chart Layers 
The following objects can be shown or hidden on the charts:
- Current side market price
- Opposite side market price
- Grid
- Period Separators
- Drawings
- Indicators
- Alerts
- Tooltips
- Pending orders
- Open positions
- Historical orders/positions
- Chart prices
The settings are applied only for the selected chart.
OHLC Index Widget 
Displays the following values for the selected time period:
- Date - date of time period
- Time - time period
- Open - opening price for time period
- High - highest price in time period
- Low - lowest price in time period
- Close - closing price of time period
- Volume - volume during time period
- Index # - number of the selected time period and total number of time periods on the current chart
- Time till Close - time remaining until time period ends
Right-click the widget to add additional display values (e.g. indicators outputs), change the color or the alignment.
Cursor Pointer 
Displays a cross hair on the chart showing the exact price and time on the axes.
Click and drag to measure distances in pips (points) and percentage on the chart. To disable the mode, click again on the Cursor Pointer icon.
Editing Objects
Right-click the chart object to open the menu and select one of the options.
Deleting Objects
To delete any chart objects, point the mouse cursor on the object in the chart, right-click and select Remove.
Alternatively, locate the object in the Navigator, right-click and select Remove.
Modifying Coordinates
The position of each objects is defined by one or several coordinates (the Fibonacci retracement in the example has two coordinates) which can be modified.
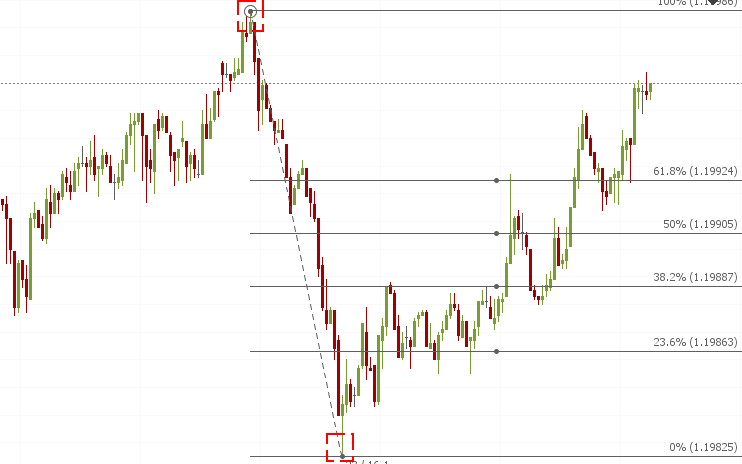
To modify coordinates:
- Double-click the object (dots should appear on the object)
- Point your cursor on the coordinate dots and click.
- Drag the coordinate and click when finished.
Alternatively, you may enter the coordinates manually:
- Right-click the object.
- Select Edit Coordinates
- Set your coordinates and click on OK
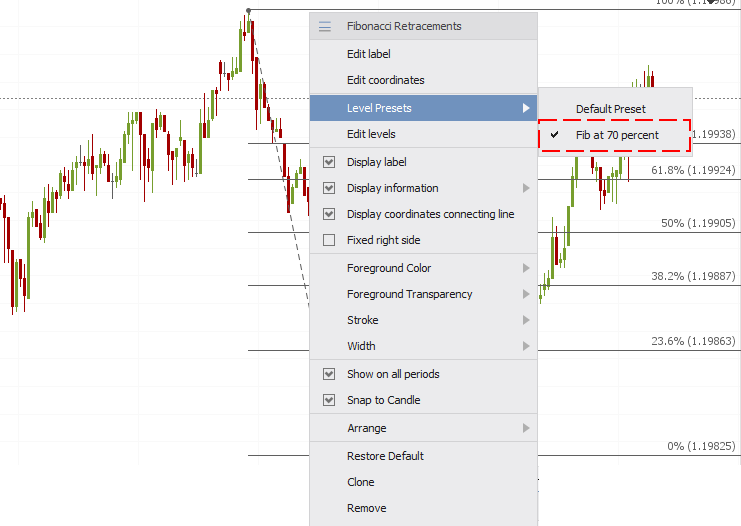
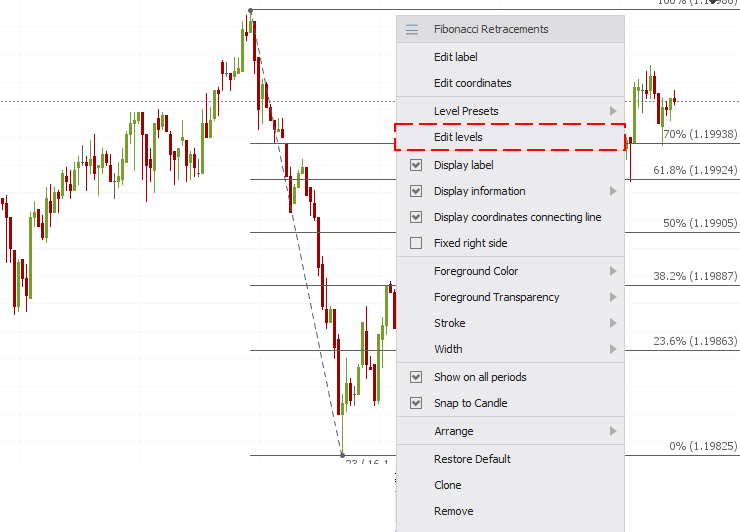
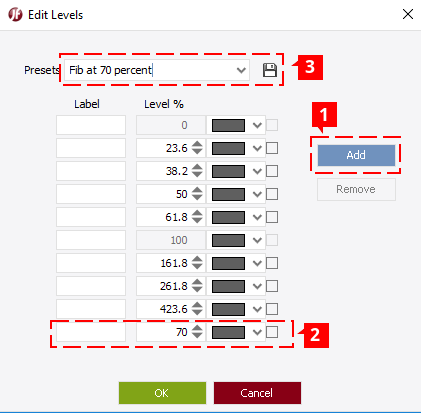
Custom Levels
Retracements and some graphical objects allow to define and also save custom levels.
To edit and save levels:
-
Right-click the object to open the menu and select Edit Levels
-
In the Edit Level window, you can change the levels or add new ones (click on Add (1)). In the example, the newly added level is set at 70 (2). Give the custom levels a new name (3) and click on the save button.
-
The new levels are now available via Level Presets.