Ray line prices by shift
A line is defined by two points. If the line is plotted in some angle, in order to retrieve a point on the line we have to carry out some trigonometric calculations. Consider a strategy which on its start creates a ray line and on every bar it calculates the price on the line for:
- last formed bar,
- 20 bars to last formed bar.
For both price values the strategy draws a small marker, as it is shown in the picture (strategy has ran for 7 full bars):
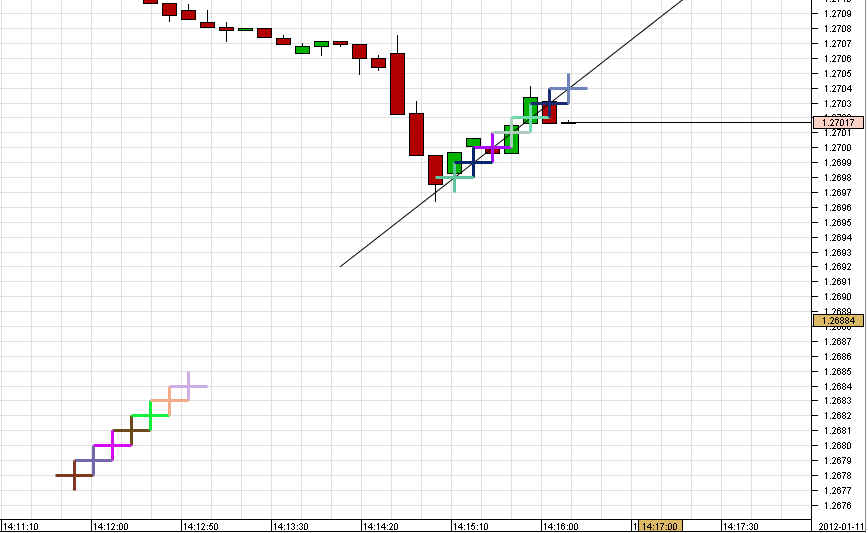
Base case
With live data the strategy is best tested with 10 second bars, since the marker gets drawn only when a bar gets finished. By moving the ray line itself also the price markers will adjust to the new values. With minor adjustments, the strategy can also be applied to short line chart objects (i.e. IShortLineChartObject). When changing chart time frames, mind to replot the ray line points, since, for instance, 09:17 point on 1 min chart gets displayed at 09:17, but on 1 hour chat - at 10:00, which changes the ray line angle. Also mind that if between the two ray line points the weekend filter filters candles, then the ray line angle will change once the filter settings get changed. package charts.test;
import java.awt.Color;
import java.text.DecimalFormat;
import java.text.SimpleDateFormat;
import java.util.Random;
import java.util.TimeZone;

import com.dukascopy.api.Configurable;
import com.dukascopy.api.IAccount;
import com.dukascopy.api.IBar;
import com.dukascopy.api.IChart;
import com.dukascopy.api.IConsole;
import com.dukascopy.api.IContext;
import com.dukascopy.api.IHistory;
import com.dukascopy.api.IMessage;
import com.dukascopy.api.IStrategy;
import com.dukascopy.api.ITick;
import com.dukascopy.api.Instrument;
import com.dukascopy.api.JFException;
import com.dukascopy.api.OfferSide;
import com.dukascopy.api.Period;
import com.dukascopy.api.RequiresFullAccess;
import com.dukascopy.api.IChartObject.ATTR_INT;
import com.dukascopy.api.drawings.IRayLineChartObject;
import com.dukascopy.api.drawings.IShortLineChartObject;

/**
 * The strategy on its start creates a ray line
 * and on every bar it caclulates the price on the line for:
 * - last formed bar,
 * - 20 bars to last formed bar.
 * For both price values the strategy draws a small marker.
 *
 */
@RequiresFullAccess
public class RayLinePriceByShift implements IStrategy {

    @Configurable("Instrument")
    public Instrument instrument = Instrument.EURUSD;

    private IChart chart;
    private IHistory history;
    private IConsole console;

    private IRayLineChartObject rayLine;
    private int counter;

    public static SimpleDateFormat sdf = new SimpleDateFormat("yyyy-MM-dd HH:mm:ss.SSS") {
        {
            setTimeZone(TimeZone.getTimeZone("GMT"));
        }
    };
    public static DecimalFormat df = new DecimalFormat("0.00000");

    @Override
    public void onStart(IContext context) throws JFException {
        this.chart = context.getChart(Instrument.EURUSD);
        this.history = context.getHistory();
        this.console = context.getConsole();
        IBar bar = history.getBar(
            chart.getInstrument(), chart.getSelectedPeriod(), chart.getSelectedOfferSide(), 0);

        rayLine = chart.getChartObjectFactory().createRayLine();
        rayLine.setPrice(0, bar.getClose());
        rayLine.setTime(0, bar.getTime());
        rayLine.setPrice(1, bar.getClose() - 0.0005); //5 pips below
        rayLine.setTime(1, bar.getTime() - chart.getSelectedPeriod().getInterval() * 5); // 5 bars behind
        chart.addToMainChartUnlocked(rayLine);

    }

    private double getPriceByShift(IRayLineChartObject rayLine, int shift) throws JFException {
        double result = 0;

        // 2 coordinates of the ray line
        long timePivot = rayLine.getTime(0);
        double pricePivot = rayLine.getPrice(0);
        long timeHandle = rayLine.getTime(1);
        double priceHandle = rayLine.getPrice(1);

        // get triangle coordinates and get tangent
        long barInterval = chart.getSelectedPeriod().getInterval();
        double priceDelta = pricePivot - priceHandle;
        double timeDelta = timePivot - timeHandle;
        double tangent = priceDelta / timeDelta;
        // for logging
        double timeDeltaInBars = timeDelta / barInterval;

        // get shifted triangle coordinates
        IBar barShifted = history.getBar(
            chart.getInstrument(), chart.getSelectedPeriod(), chart.getSelectedOfferSide(), shift);
        double timeDeltaShifted = barShifted.getTime() - timeHandle;
        double priceDeltaShifted = timeDeltaShifted * tangent;
        // for logging
        double timeDeltaShiftedInBars = timeDeltaShifted / barInterval;

        result = priceHandle + priceDeltaShifted;
        print(String.format("shift=%s, result=%s, priceDelta=%s, timeDelta=%s," +
            " timeInBars=%s, tangent=%s, timeDeltaShifted=%s, "+
            "timeDeltaShiftedInBars=%s, priceDeltaShifted=%s, barTime=%s",
            shift, df.format(result), df.format(priceDelta),
            timeDelta,
            df.format(timeDeltaInBars),
            (new DecimalFormat("0.00000##########")).format(tangent),
            timeDeltaShifted,
            df.format(timeDeltaShiftedInBars), df.format(priceDeltaShifted),
            sdf.format(barShifted.getTime())));

        return result;
    }

    private void print(Object o) {
        console.getOut().println(o);
    }

    @Override
    public void onTick(Instrument instrument, ITick tick) throws JFException {
    }

    @Override
    public void onBar(Instrument instrument, Period period, IBar askBar, IBar bidBar) throws JFException {
        if (instrument != chart.getInstrument() || period != chart.getSelectedPeriod()) {
            return;
        }
        IBar bar = chart.getSelectedOfferSide() == OfferSide.BID ? bidBar : askBar;

        int shift1 = 0;
        int shift2 = 20;

        double price1 = getPriceByShift(rayLine, shift1);
        double price2 = getPriceByShift(rayLine, shift2);

        drawMarker(price1, bar.getTime() - period.getInterval() * (shift1 - 1));
        drawMarker(price2, bar.getTime() - period.getInterval() * (shift2 - 1));
    }

    private void drawMarker(double price, long time) {

        Color color = new Color(
            new Random().nextInt(256),
            new Random().nextInt(256),
            new Random().nextInt(256));
        double pip = 0.0001;
        IShortLineChartObject line = chart.getChartObjectFactory().createShortLine();
        line.setPrice(0, price - pip);
        line.setTime(0, time);
        line.setPrice(1, price + pip);
        line.setTime(1, time);
        line.setColor(color);
        line.setAttrInt(ATTR_INT.WIDTH, 3);
        chart.addToMainChart(line);

        IShortLineChartObject line2 = chart.getChartObjectFactory().createShortLine();
        line2.setPrice(0, price);
        line2.setTime(0, time - chart.getSelectedPeriod().getInterval());
        line2.setPrice(1, price);
        line2.setTime(1, time + chart.getSelectedPeriod().getInterval());
        line2.setColor(color);
        line2.setAttrInt(ATTR_INT.WIDTH, 3);
        line2.setText(String.valueOf(++counter));
        chart.addToMainChart(line2);

    }

    @Override
    public void onMessage(IMessage message) throws JFException {
    }

    @Override
    public void onAccount(IAccount account) throws JFException {
    }

    @Override
    public void onStop() throws JFException {
        //remove all chart objects on stop
        chart.removeAll();
    }

}Case with filter and period adjustment
Consider adjusting the previous example such that the price markers get plotted on the line even if: The drawn ray line time coordinates, because of the rounding, don't match the actual ones that are used in calculations. Some candle sticks within the work range have been filtered.
RayLinePriceByShiftFilter.java