Add Indicators on Chart
The IChartPanel.add methods get used to plot an indicator on chart. One can retrieve parameters and appearance information of already plotted indicators by calling the IChartPanel.getIndicatorApperanceInfos method. One can also plot another indicator or chart objects on the same indicator panel.
Use optional parameters
The following methods may be used to add indicators on chart. The latter method lets you specify values for indicator optional parameters.
chart.add(indicators.getIndicator("ZIGZAG"));
chart.add(indicators.getIndicator("ET_Nico"), new Object[]{15});
Specify output style
Use the following code to specify the applied price, drawing style, colors, etc for the indicator you add:
IChart chart = context.getChart(Instrument.EURUSD);
IIndicator indCOG = indicators.getIndicator("COG");
for (int i = 0; i < indCOG.getIndicatorInfo().getNumberOfInputs(); i++) {
  InputParameterInfo inputParameterInfo = indCOG.getInputParameterInfo(i);
  inputParameterInfo.setAppliedPrice(AppliedPrice.LOW);
}

chart.add(indCOG, new Object[]{5, 6, MaType.SMA.ordinal()}, new Color[]{Color.RED, Color.GREEN},
  new DrawingStyle[]{DrawingStyle.DASHDOT_LINE, DrawingStyle.LINE}, new int[]{1, 2});
Object array optParams, the second parameter of chart.addIndicator, stands for indicator-specific parameters whose info can be retrieved from indicator metadata.
Use on-chart indicator parameters
As mentioned above, one can retrieve parameters and appearance information of already plotted indicators by calling the IChartPanel.getIndicatorApperanceInfos method. Consider a strategy which calculates indicators with the same parameters as they appear on the last selected chart:
private IIndicators indicators;
private IHistory history;
private IConsole console;
private IChart chart;

private int dataCount = 3;

@Override
public void onStart(IContext context) throws JFException {
    indicators = context.getIndicators();
    history = context.getHistory();
    console = context.getConsole();
    chart = context.getLastActiveChart();
    if (chart == null) {
        console.getErr().println("No chart opened!");
        return;
    }
    IFeedDescriptor feedDescriptor = chart.getFeedDescriptor();
    if(feedDescriptor.getDataType() == DataType.TICKS){
        console.getWarn().println("Tick charts need to get calculate with from-to method");
        return;
    }

    for (IIndicatorAppearanceInfo info : chart.getIndicatorApperanceInfos()) {
        AppliedPrice[] appliedPrices = new AppliedPrice[info.getDrawingStyles().length];
        Arrays.fill(appliedPrices, AppliedPrice.CLOSE);
        OfferSide[] offerSides = new OfferSide[info.getDrawingStyles().length];
        Arrays.fill(offerSides, chart.getSelectedOfferSide());
        IIndicator indicator = indicators.getIndicator(info.getName());
        ITimedData feedData = history.getFeedData(feedDescriptor, 0);
        Object[] result = indicators.calculateIndicator(
                feedDescriptor, offerSides, info.getName(), appliedPrices, info.getOptParams(),
                dataCount, feedData.getTime(), 0);
        for (int i = 0; i < indicator.getIndicatorInfo().getNumberOfOutputs(); i++) {
            OutputParameterInfo.Type outputType = indicator.getOutputParameterInfo(i).getType();
            String resultStr =
                    outputType == OutputParameterInfo.Type.DOUBLE ? Arrays.toString((double[]) result[i])
                    : outputType == OutputParameterInfo.Type.INT ? Arrays.toString((int[]) result[i])
                    : "object outputs need special processing";
            console.getOut().format(
                "%s %s last %s values: %s",
                info.getName(), indicator.getOutputParameterInfo(i).getName(), dataCount, resultStr).println();
        }

    }
    context.stop();
}
CalculateIndicatorsFromChart.java
Include in OHLC
Consider a strategy which plots EMA and MACD indicators on chart and adds an OHLC informer with indicator showing option. The strategy also calculates the indicators on every bar, such that one can verify that the values match:
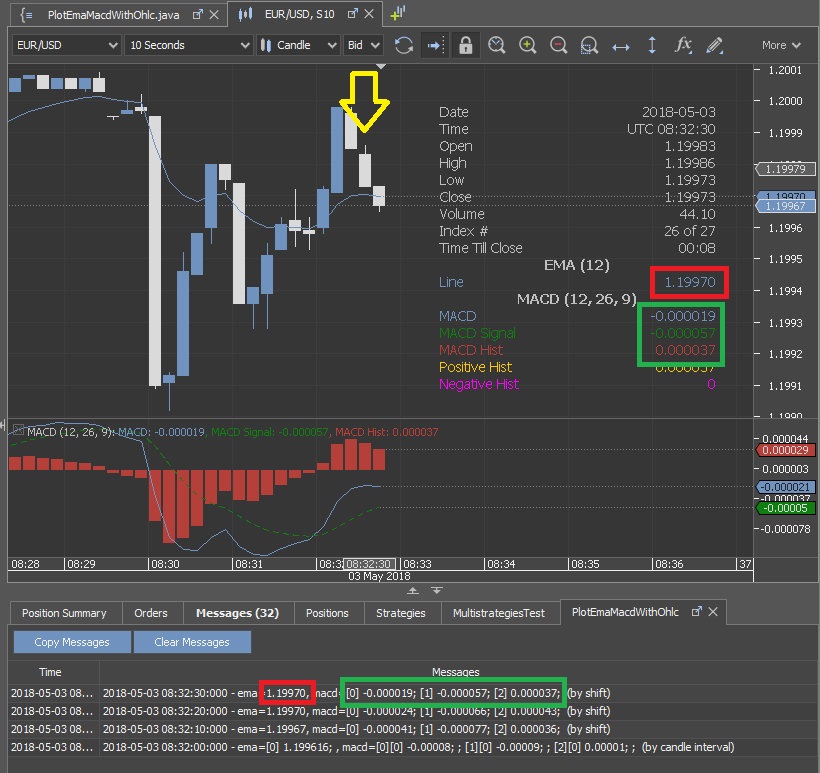
The function that adds the indicators and the OHLC informer:
    public void onStart(IContext context) throws JFException {
        this.console = context.getConsole();
        this.indicators = context.getIndicators();

        IChart chart = null;
        for(IChart c : context.getCharts(instrument)){
            if(c.getSelectedOfferSide() == this.side
                    && c.getSelectedPeriod() == this.period
                    && c.getFilter() == this.filter){
                chart = c;
                break;
            }
            if(c.getFilter() != this.filter){
                console.getErr().println(
                    "Filter dismatch! Change in platform settings the filter " +
                            "to the same one that the strategy is using!");
                context.stop();
            }
        }
        if(chart == null){
            chart = context.openChart(new TimePeriodAggregationFeedDescriptor(instrument, period, side, filter));
        }

        chart.add(indicators.getIndicator("EMA"),
                  new Object[] { emaTimePeriod });
        chart.add(indicators.getIndicator("MACD"),
                  new Object[] { macdFastPeriod, macdSlowPeriod, macdSignalPeriod });

        IOhlcChartObject ohlc = null;
        for (IChartObject obj : chart.getAll()) {
            if (obj instanceof IOhlcChartObject) {
                ohlc = (IOhlcChartObject) obj;
            }
        }
        if (ohlc == null) {
            ohlc = chart.getChartObjectFactory().createOhlcInformer();
            chart.add(ohlc);
        }
        ohlc.setShowIndicatorInfo(true);

        //calculate on the previous bar over candle interval such that the filters get used
        long time = context.getHistory().getBar(instrument, period, side, 1).getTime();
        double[][] macd = indicators.macd(instrument, period, side, AppliedPrice.CLOSE,
            macdFastPeriod, macdSlowPeriod, macdSignalPeriod, filter, 1, time, 0);

        double[] ema = indicators.ema(instrument, period, side, AppliedPrice.CLOSE,
            emaTimePeriod, filter, 1, time, 0);

        console.getOut().format("%s - ema=%s, macd=%s (by candle interval)",
            DateUtils.format(time), arrayToString(ema), arrayToString(macd)).println();
}Also consider a generalized version that works with any feed:
Plot on newly opened chart
Consider creating a wrapper class which describes both the indicator data and the feed it is supposed to be calculated on:
    class IndDataAndFeed{

        private IFeedDescriptor feedDescriptor;
        private String indicatorName;
        private Object[] optionalInputs;
        private int outputIndex;
        private IIndicator indicator;
        private IChart chart;

        public IndDataAndFeed(
                String indicatorName, Object[] optionalInputs, int outputIndex, IFeedDescriptor feedDescriptor) {
            this.feedDescriptor = feedDescriptor;
            this.indicatorName = indicatorName;
            this.optionalInputs = optionalInputs;
            this.outputIndex = outputIndex;
        }

        public void openChartAddIndicator(){
            for(IChart openedChart : context.getCharts(feedDescriptor.getInstrument())){
                IFeedDescriptor chartFeed = openedChart.getFeedDescriptor();
                if(chartFeed.getPeriod() == feedDescriptor.getPeriod()
                        && chartFeed.getOfferSide() == feedDescriptor.getOfferSide()){
                    chart = openedChart;
                }
            }
            if(chart == null){
                chart = context.openChart(feedDescriptor);
            }
            if(chart.getFeedDescriptor().getFilter() != feedDescriptor.getFilter()){
                console.getErr().println("Chart filter " + chart.getFeedDescriptor().getFilter() +
                    " does not match indicator feed filter " + feedDescriptor.getFilter() +
                    " please adjust the platform settings");
                context.stop();
            }
            indicator = indicators.getIndicator(indicatorName);

            int outputCount = indicator.getIndicatorInfo().getNumberOfOutputs();
            Color[] colors = new Color[outputCount];
            DrawingStyle[] styles = new DrawingStyle[outputCount];
            int[] widths = new int[outputCount];
            for(int outIdx = 0; outIdx< outputCount; outIdx++){
                OutputParameterInfo outInfo = indicator.getOutputParameterInfo(outIdx);
                if(outInfo == null){
                    console.getErr().println(indicatorName + " "  + outIdx + "is null");
                    continue;
                }
                //make colors darker
                colors[outIdx] = new Color(new Random().nextInt(256 * 256 * 256));
                //make solid-line inputs dashed
                styles[outIdx] = outInfo.getDrawingStyle() == DrawingStyle.LINE ?
                        DrawingStyle.DASH_LINE :
                        outInfo.getDrawingStyle();
                //thicken the 1-width lines
                widths[outIdx] = 2;
            }

            chart.add(indicator, optionalInputs, colors, styles, widths);

            //show indicator values in ohlc
            IOhlcChartObject ohlc = null;
            for (IChartObject obj : chart.getAll()) {
                if (obj instanceof IOhlcChartObject) {
                    ohlc = (IOhlcChartObject) obj;
                }
            }
            if (ohlc == null) {
                ohlc = chart.getChartObjectFactory().createOhlcInformer();
                chart.add(ohlc);
            }
            ohlc.setShowIndicatorInfo(true);
        }

        public double getCurrentValue() throws JFException{
            Object[] outputs = indicators.calculateIndicator(
                    feedDescriptor,
                    new OfferSide[] { feedDescriptor.getOfferSide() },
                    indicatorName,
                    new AppliedPrice[] { AppliedPrice.CLOSE },
                    optionalInputs,
                    0);
            double value = (Double) outputs[outputIndex];
            return value;
        }

        public void removeFromChart(){
            if(chart != null && indicator != null){
                chart.removeIndicator(indicator);
            }
        }

        @Override
        public String toString(){
            return String.format("%s %s on %s %s feed",
                indicatorName,
                Arrays.toString(optionalInputs),
                feedDescriptor.getOfferSide(),
                feedDescriptor.getPeriod());
        }

    }
Then add a list of indicators which you wish to calculate and plot on respective chart:
    private List<IndDataAndFeed> calculatableIndicators = new ArrayList<>(Arrays.asList(new IndDataAndFeed[]{
            new IndDataAndFeed("MACD", new Object[] {12,26,9}, 0,
                               new TimePeriodAggregationFeedDescriptor(
                                       instrument, Period.FIVE_MINS, OfferSide.BID, Filter.WEEKENDS)),
            new IndDataAndFeed("RSI", new Object[] {50}, 0,
                               new TimePeriodAggregationFeedDescriptor(
                                       instrument, Period.FIVE_MINS, OfferSide.BID, Filter.WEEKENDS)),
            new IndDataAndFeed("RSI", new Object[] {50}, 0,
                               new TimePeriodAggregationFeedDescriptor(
                                       instrument, Period.ONE_HOUR, OfferSide.BID, Filter.WEEKENDS)),
            new IndDataAndFeed("CCI", new Object[] {14}, 0,
                               new TimePeriodAggregationFeedDescriptor(
                                       instrument, Period.FIFTEEN_MINS, OfferSide.BID, Filter.WEEKENDS)),
            new IndDataAndFeed("CCI", new Object[] {14}, 0,
                               new TimePeriodAggregationFeedDescriptor(
                                       instrument, Period.ONE_HOUR, OfferSide.BID, Filter.WEEKENDS))
    }));
And finally make calls from the strategy:
    @Override
    public void onStart(IContext context) throws JFException {

        if(!context.getSubscribedInstruments().contains(instrument)){
            context.setSubscribedInstruments(
                    new HashSet<Instrument>(
                            Arrays.asList(new Instrument [] {instrument})), true);
        }

        this.context = context;
        console = context.getConsole();
        indicators = context.getIndicators();

        for(IndDataAndFeed indDataAndFeed : calculatableIndicators){
            indDataAndFeed.openChartAddIndicator();
        }
    }

    @Override
    public void onTick(Instrument instrument, ITick tick) throws JFException {
        if (instrument != this.instrument) {
            return;
        }
        for (IndDataAndFeed indDataAndFeed : calculatableIndicators) {
            double value = indDataAndFeed.getCurrentValue();
            print("%s current value=%.5f", indDataAndFeed, value);
        }
    }

    @Override
    public void onStop() throws JFException {
        for(IndDataAndFeed indDataAndFeed : calculatableIndicators){
            indDataAndFeed.removeFromChart();
        }
    }
FeedMultiIndOpenChartsOhlc.java
Randomize output style and include in OHLC
Consider modifying the previous example, by modifying the indicator ouput styles and including the indicator values in the OHLC information object:
public void openChartAddIndicator(){
    for(IChart openedChart : context.getCharts(feedDescriptor.getInstrument())){
        IFeedDescriptor chartFeed = openedChart.getFeedDescriptor();
        if(chartFeed.getPeriod() == feedDescriptor.getPeriod() &&
                        chartFeed.getOfferSide() == feedDescriptor.getOfferSide()){
            chart = openedChart;
        }
    }
    if(chart == null){
        chart = context.openChart(feedDescriptor);
    }
    if(chart.getFeedDescriptor().getFilter() != feedDescriptor.getFilter()){
        console.getErr().println(
                "Chart filter " + chart.getFeedDescriptor().getFilter() +
                                " does not match indicator feed filter " +
                                feedDescriptor.getFilter() + " please adjust the platform settings");
        context.stop();
    }
    indicator = indicators.getIndicator(indicatorName);

    int outputCount = indicator.getIndicatorInfo().getNumberOfOutputs();
    Color[] colors = new Color[outputCount];
    DrawingStyle[] styles = new DrawingStyle[outputCount];
    int[] widths = new int[outputCount];
    for(int outIdx = 0; outIdx< outputCount; outIdx++){
        OutputParameterInfo outInfo = indicator.getOutputParameterInfo(outIdx);
        if(outInfo == null){
            console.getErr().println(indicatorName + " "  + outIdx + "is null");
            continue;
        }
        //make colors darker
        colors[outIdx] = new Color(new Random().nextInt(256 * 256 * 256));
        //make solid-line inputs dashed
        styles[outIdx] = outInfo.getDrawingStyle() == DrawingStyle.LINE ?
                    DrawingStyle.DASH_LINE :
                        outInfo.getDrawingStyle();
        //thicken the 1-width lines
        widths[outIdx] = 2;
    }

    chart.add(indicator, optionalInputs, colors, styles, widths);

    //show indicator values in ohlc
    IOhlcChartObject ohlc = null;
    for (IChartObject obj : chart.getAll()) {
        if (obj instanceof IOhlcChartObject) {
            ohlc = (IOhlcChartObject) obj;
        }
    }
    if (ohlc == null) {
        ohlc = chart.getChartObjectFactory().createOhlcInformer();
        chart.add(ohlc);
    }
    ohlc.setShowIndicatorInfo(true);
}
FeedMultiIndOpenChartsOhlc.java