Pattern Analysis
The trading platform provides advanced functionalities that help to find and identify the following chart patterns:
- Ascending/desending triangle
- Channel up/down
- Double top/bottom
- Falling/rising wedge
- Broadening rising/falling wedge
- Triple top/bottom
- Rectangle/Triangle
Pattern Analysis Widget
To open the Pattern Analysis Widget and search for chart patterns:
- Click on the Pattern Analysis Widget icon
 in the icon bar above the chart.
 - By default, Scan mode is set to All instruments but this can be customized. Further options are available in the Customization window (right-click anywhere on the widget, more on the options below).
- The widget scans the charts for currently emerging patterns.
- When the widget has finished scanning, the found patterns are displayed in the drop-down menu.
- Select the pattern of interest from the menu and click on Go to jump to the chart pattern.
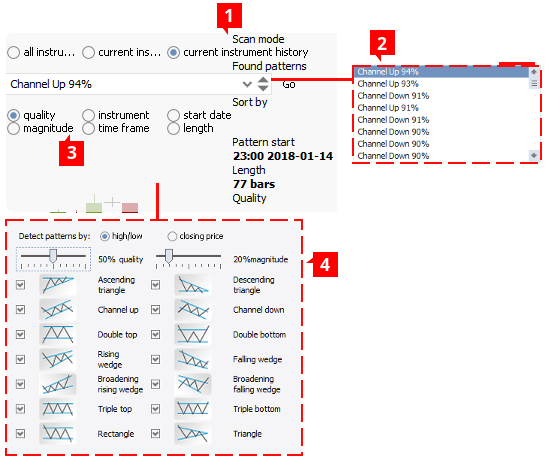
- Scan mode (1) - mode used for searching patterns.
- All instruments - default mode. It will scan all the currency pairs (despite what pair or chart you are currently in) for currently emerging patterns.
- Current instrument - will scan the current instrument chart for currently emerging patterns.
- Drop down menu (2) - the widget lists all patterns that were found in this menu.
- Current pair history - will show all the patterns that have ever emerged in the current instrument and chart.
- Sort by (3) - results in the drop down list can be arranged using several options:
- Time - patterns in the list will be arranged according to the date when they started;
- Size - patterns in the list will be arranged according to how many bars create a pattern;
- Quality - patterns in the list will be arranged according to their quality rating
- Magnitude - patterns in the list will be arranged according to their magnitude rating.
- Instrument - patterns in the list will be alphabetically arranged according to the instrument's name (AUD/CAD at the top, XAU/USD at the bottom of the list).
- Period - patterns in the list will be arranged according to the time frame of the chart (patterns on 10 sec. charts will be at the top, patterns on monthly charts will be at the bottom of the list).
- Customization window (4) - right-click anywhere on the widget to open this window.
Pattern Characteristics
Qualities
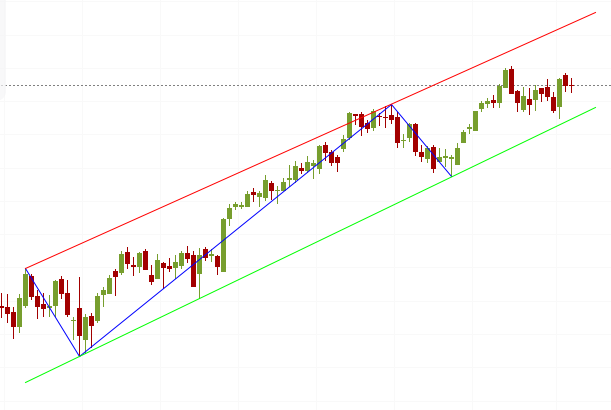
Quality is a reading which quantifies a pattern’s trend. It shows how well a price fits in the boundaries of a pattern's support and resistance (green and red lines) and how well it moves from one touch point to another (blue). Calculations include the symmetry or asymmetry (depending on the pattern at hand) of support and resistance lines, the number of touch points and gaps between them, and a few other factors.
Magnitude
Magnitude is a reading which shows expected returns of a financial instrument which has formed a chart pattern. Calculation takes in to account minimum and maximum prices of the pair in chart and historical volatility. This helps to approximate the scale of the pair’s movements and potential returns after the pair breaks the pattern’s boundaries