Strategy Tutorial
This tutorial contains information how to create and develop JForex strategies. The tutorial starts with a simple strategy which only prints a message, then proceeds to trading strategy which with each section gets more evolved as we add historical data, indicator and chart usage. Although all of the given strategies can be developed within the JForex platform, please consider the usage of an Integrated Development Environment (IDE) for strategy development.
Simple Strategy
At first, we will create simple strategy by right-clicking the Strategies node in the Navigator panel and choosing New Strategy.
JForex platform generates a new file and opens it in the editor. Try to compile the file by pressing F5 or compile button:
JForex will ask you to name and save the java file on your hard drive.
If you save the file with a custom filename, then don't forget to change the class' name in the generated file. The file name and class name must be the same. E.g. if we save the file as StartStrategy.java then the class name also must be StartStrategy.
//filename - StartStrategy.java
import com.dukascopy.api.*;

public class StartStrategy implements IStrategy { //class name must match the file name
    private IEngine engine;
private IConsole console;Modify onStart
The generated strategy class implements the IStrategy interface. The strategy methods are implemented with empty method bodies in the generated strategy java file. Modify the onStart method. This method is called every time when one starts a strategy. Fill the onStart method's body with the following code:
public void onStart(IContext context) throws JFException { this.engine = context.getEngine(); this.console = context.getConsole(); this.history = context.getHistory(); this.context = context; this.indicators = context.getIndicators(); this.userInterface = context.getUserInterface(); //added code: console.getOut().println("Method onStart() called"); }
Compile the file by pressing F5 or compile button.
Run the strategy
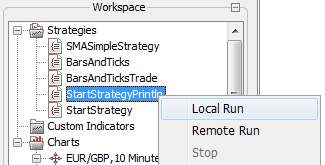
Test the strategy by right-clicking the strategy in JForex and choose Local Run.
There are three things that indicate that the strategy has been called:
-
Strategy's icon is changed under the Strategies node - a green triangle is added indicating that the strategy is in running state:

-
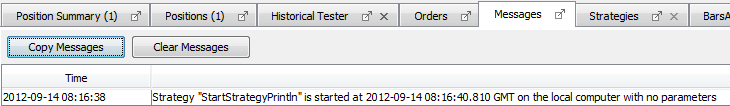
In the Messages tab a new message is added:
-
A new tab is opened for started strategy. This tab shows the output of the strategy. In this case we see that the println statement has been executed successfully and printed "Method onStart() called":

Make Simple Trade
Define Parameters
The strategy parameters get set before the execution of the onStart method. Open the strategy's java file in editor and add a parameter to the java file. Read the article Strategy parameters to learn more about the strategy parameters.
@Configurable(value="Instrument value")
public Instrument myInstrument = Instrument.EURGBP;
@Configurable(value="Offer Side value", obligatory=true)
public OfferSide myOfferSide;
@Configurable(value="Period value")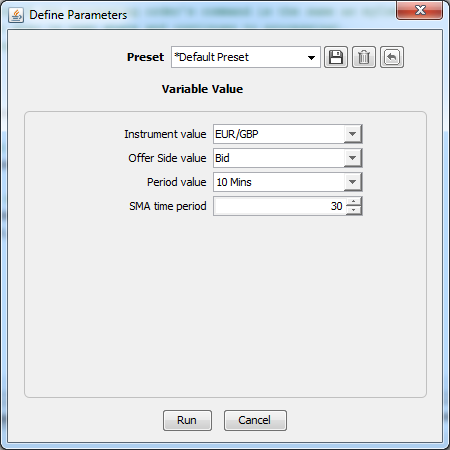
public Period myPeriod = Period.TEN_MINS;Compile the file. On strategy launch the "Define Parameters" dialog appears. Here one can modify the strategy parameter values.
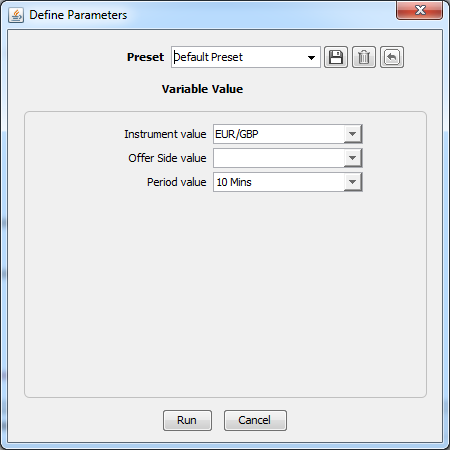
After setting the parameter values choose Run to start the strategy.
Getting Bars and Ticks
In this part of the tutorial we are using the previously defined parameters. These parameters are used to get IBar and ITick objects. One can visit History Bars or History Ticks to learn more about bars and ticks.
At first define bar and tick. object references in the class:
  private IBar previousBar;
  private ITick myLastTick;
Initialize previousBar and myLastBar object references in the onStart method by using IHistory.getBar and IHistory.getLastTick methods:
  previousBar = history.getBar(myInstrument, myPeriod, myOfferSide, 1);
  myLastTick = history.getLastTick(myInstrument);
Next we should give some output so one can check values in the chart and in the output of the strategy:
  console.getOut().println(previousBar);
  console.getOut().println(myLastTick);
Before to run the strategy, one needs to subscribe to an instrument by using a IContext.setSubscribedInstruments method. Put the following code before the IBar initialization code:
  Set<Instrument> instruments = new HashSet<Instrument>();
  instruments.add(myInstrument);
  context.setSubscribedInstruments(instruments, true);
Compile the file.
When one runs the strategy, three things happen:
-
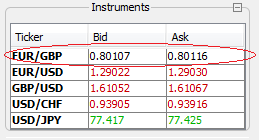
If the chosen instrument is not in the list of Instruments window, it is added (that's why we need to subscribe an instrument; if the instrument is not subscribed, then the strategy will not work)
-
The message in Messages tab is displayed. The message also shows the values of the parameters.

-
The output messages from strategy are displayed in strategy's tab.
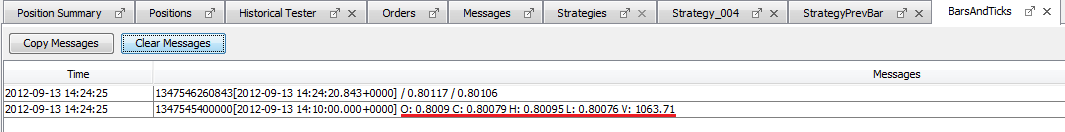
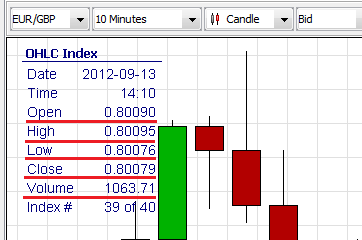
Notice the open and close values of the bar. These will be required to compare chart values and bar values.
Compare the strategy's output with chart output!
Open the desired chart according to instrument that will be selected in the "Define Parameters" dialog. Set the same Period Value for the chart as it will be in "Define Parameters" dialog. Next, run the strategy. Compare the Open, Close, High, Low, and Volume parameters from strategy's output tab and chart's last completed bar. These must be the same:
Make a Trade
At first write an import statement to import OrderCommand enum. This enum defines commands - SELL and BUY. We will need these enum constants later.
import com.dukascopy.api.IEngine.OrderCommand;In this example we are using the previously created strategy java file - BarsAndTicks.java. Now add some code for trading. At first write a line of code that will decide whether to sell or buy. In this case we are making this decision based upon the last completed bar. All of the following code is added to the onStart method. If the bar's getOpen method's retrieved value is smaller than the getClose value (green bar), then we will buy, if opposite (red bar), then we will sell:
OrderCommand myCommand = previousBar.getOpen() > previousBar.getClose() ? OrderCommand.SELL : OrderCommand.BUY;When we know what kind of trading operation we will do, we can execute our OrderCommand by using an IEngine's method submitOrder. The submitOrder method takes as it's parameter a String object - the order label. Remember that this label for every order must be unique.
engine.submitOrder("MyStrategyOrder2", myInstrument, myCommand, 0.1);Here is the complete java file - BarsAndTicks.java
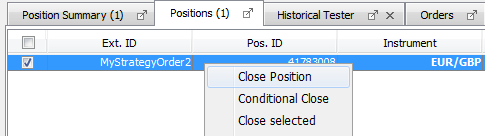
Compile the file and run the strategy. Notice that in the Positions tab there is a new entry where Ext.ID equals with "MyStrategyOrder2". This is the order label which we gave as the parameter to the IEngine.submitOrder method.

One can close the order by selecting the order's checkbox in Positions tab then right-clicking and choosing Close Position:
Trade According to Last Completed Bar
In this part of the tutorial we will modify previously created strategy BarsAndTicksTrade.java. The onBar method is called on every bar for every basic period and instrument that the application is subscribed on. To work with specific instruments only in onBar method, we will need to filter them out. In this example we will show how to log the order's events with an onMessage method. To log messages related to the order from all other messages, we will need to filter them out. In this example we're simulating logging by simply printing out to the strategy's output tab.
Create the Logic in the onBar method
Move our previously created strategy's logic from the onStart method to onBar method. Here is the onStart method after movement:
public void onStart(IContext context) throws JFException {
        this.engine = context.getEngine();
        this.console = context.getConsole();
        this.history = context.getHistory();
        this.context = context;
        this.indicators = context.getIndicators();
        this.userInterface = context.getUserInterface();

        //subscribe an instrument:
        Set<Instrument> instruments = new HashSet<Instrument>();
        instruments.add(myInstrument);
        context.setSubscribedInstruments(instruments, true);
    }
Define a new instance parameter of IOrder type. We will need this IOrder object later on to verify existing orders with the same label:
private IOrder order;Next, implement the onBar method as follows:
/*
* Implement our business logic here. Filter specific instrument and period.
* Get the order and check whether the order with the same label exists in open state,
* if yes then close it. Make a decision and submit a new order.
*/
public void onBar(Instrument instrument, Period period, IBar askBar, IBar bidBar) throws JFException {
    if (!instrument.equals(myInstrument) || !period.equals(myPeriod)) {
        return; //quit
    }

    //check and close the order:
    order = engine.getOrder("MyStrategyOrder");
    if(order != null && engine.getOrders().contains(order)){
        order.close();
        order.waitForUpdate(IOrder.State.CLOSED); //wait till the order is closed
        console.getOut().println("Order " + order.getLabel() + " is closed");
    } else if (order == null) {
        console.getOut().println("No order to close");
    }

    //if previousBar is GREEN (bullish) then BUY, if RED (bearish) then SELL
    previousBar = myOfferSide == OfferSide.ASK ? askBar : bidBar;
    console.getOut().println(" || PreviousBar- --> " + previousBar + " || Period- --> " + period + " || Instrument- --> " + instrument);
    OrderCommand myCommand = previousBar.getOpen() > previousBar.getClose() ? OrderCommand.SELL : OrderCommand.BUY;
    engine.submitOrder("MyStrategyOrder", myInstrument, myCommand, 0.1);
}
Log an Order
Implement the onMessages method as the following:
/*
 * filter out from all IMessages the messages related with orders and
 * log them to the strategy's output tab
 */
public void onMessage(IMessage message) throws JFException {
    if(message.getOrder() != null)
        console.getOut().println("order: " + message.getOrder().getLabel() + " || message content: " + message.getContent());
}
Click here to learn more about logging. Here is the complete strategy's java file - OnBarExample.java
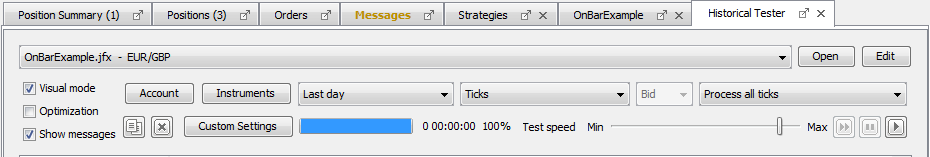
One can check how the strategy works in real situations with a real historic data by using a Historical Tester. We test our strategy based upon the data of the last day. To do this, select the Tools-Historical Tester to open the historical tester's tab. Choose the strategy from a drop-down list; press the Instrument button to set the desired instrument; set the period in a drop-down list to Last day; set the period to Ticks. Finally, press the play button to start the test.
If You're interested in more details how to work with Historical Tester, visit the Historical Tester's wiki.
Test results opens in a browser by default.
Trade According to SMA Trend
The strategy of this part of the tutorial will trade according to changes of SMA indicator - buy on up-trend and sell on down-trend. We will use a SMA (Simple Moving Average) indicator and upgrade our previously created strategy java file.
The idea is to use a Indicators.sma method to get values for last two completed bars (second-to-last and last) and make a decision according to values of these bars. In this case we use the sma method which takes candle intervals as parameters. Click here to learn more how to use candle intervals for indicator calculation.
Let's prepare the strategy for our new implementation of the onBar method. We will need to set the time period attribute for the sma method and few constants for the sma method's returned array. Plus we will add one utility method to print messages to the console:
@Configurable("SMA time period")
public int smaTimePeriod = 30;

private static final int PREV = 1;
private static final int SECOND_TO_LAST = 0;

private void printMe(String toPrint){
    console.getOut().println(toPrint);
}
Here is a complete code of the onBar method:
public void onBar(Instrument instrument, Period period, IBar askBar, IBar bidBar) throws JFException {
  if (!instrument.equals(myInstrument) || !period.equals(myPeriod)) {
        return; //quit
    }

    IEngine.OrderCommand myCommand = null;
    int candlesBefore = 2, candlesAfter = 0;
    //get SMA values of 2nd-to last and last (two last completed) bars
    previousBar = myOfferSide == OfferSide.ASK ? askBar : bidBar;
    long currBarTime = previousBar.getTime();
    double sma[] = indicators.sma(instrument, period, myOfferSide, IIndicators.AppliedPrice.CLOSE,
            smaTimePeriod, Filter.NO_FILTER, candlesBefore, currBarTime, candlesAfter);

    /*print some message so we can later compare the results with a chart,
     *If SMA is up-trend (green line in sample picture) execute BUY order.
     *If SMA is down-trend (red line in sample picture) execute SELL order.
     */
    printMe(String.format("Bar SMA Values: Second-to-last = %.5f; Last Completed = %.5f", sma[SECOND_TO_LAST], sma[PREV]));
    if(sma[PREV] > sma[SECOND_TO_LAST]){
        printMe("SMA in up-trend"); //indicator goes up
         myCommand = IEngine.OrderCommand.BUY;
    } else if(sma[PREV] < sma[SECOND_TO_LAST]){
        printMe("SMA in down-trend"); //indicator goes down
        myCommand = IEngine.OrderCommand.SELL;
    } else {
        return;
    }

    /*check if the order already exists. If exists, then check if the processing order's command is the same as myCommand.
     * If it is the same, then do nothing (let the order stay in open state and continues to processing).
     * If the order command is different (SMA trend changes direction) from the current order's command,
     * then close the opened order and create a new one:
     */
    order = engine.getOrder("MyStrategyOrder");
    if(order != null && engine.getOrders().contains(order) && order.getOrderCommand() != myCommand){
        order.close();
        order.waitForUpdate(IOrder.State.CLOSED); //wait till the order is closed
        console.getOut().println("Order " + order.getLabel() + " is closed");
    }
    //if the order is new or there is no order with the same label, then create a new order:
    if(order == null || !engine.getOrders().contains(order)){
        engine.submitOrder("MyStrategyOrder", instrument, myCommand, 0.1);
    }

}
Here is a complete strategy's java file - SMASampleTrade.java
Test our strategy for few days with Historical Tester. When the chart opens, confirm that the period is the same as you gave as a parameter. We're using following parameters in this sample:
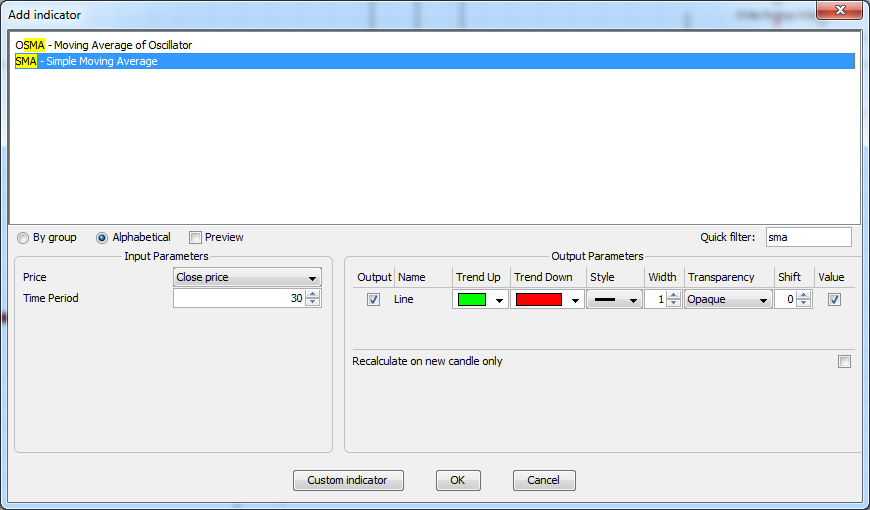
Add SMA indicator to the chart by clicking on the f(x) button, then choose Add Indicator. In a Quick Filter search for SMA - Simple Moving Average and set the following parameters:
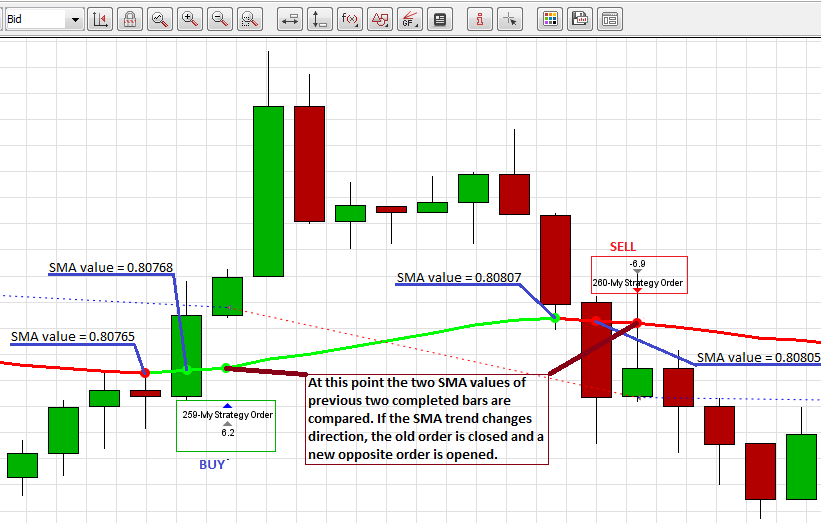
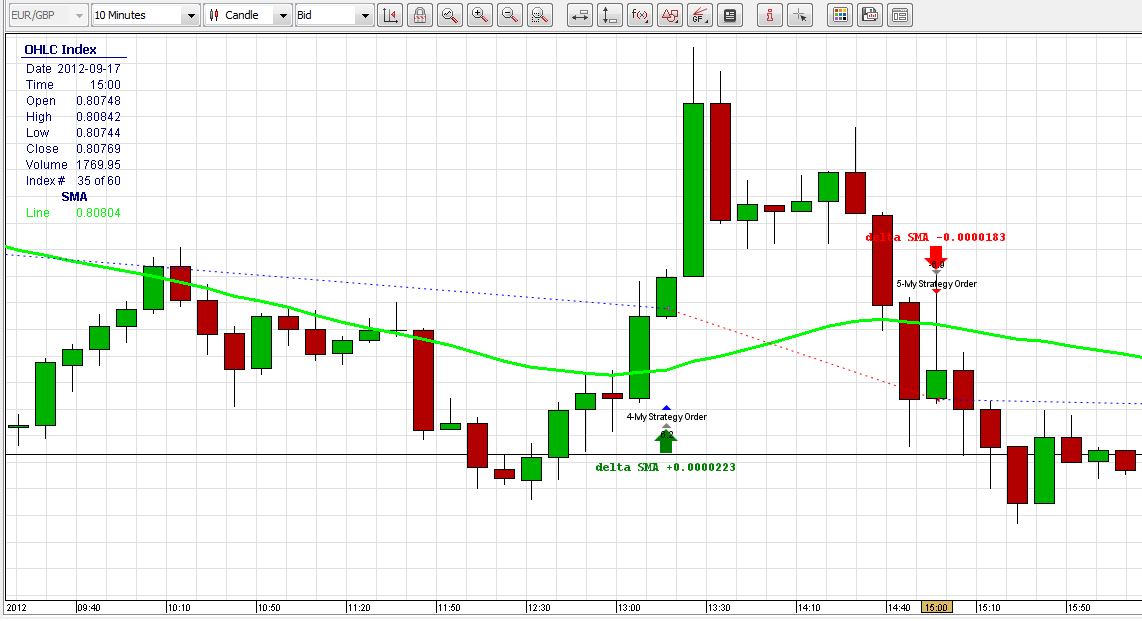
One can see, that the decision is made upon the two last completed bars. If a SMA trend line starts to go up then we sell, if down then buy. Check also the strategy's output - here you can see the SMA indicators for two last completed bars (last and second-to-last) and the order's messages.
Click here to learn more about the Indicator Calculation.
Representing Events on Chart
In this part of the tutorial one can learn how to add chart objects to a chart and how to customize them. We will add and customize an SMA indicator, IOhlcChartObject, ISignalDownChartObject, and ISignalUpChartObject objects. This strategy will make orders according to the SMA values and add the ISignalDownChartObject or the ISignalUpChartObject object to the chart in the point of time-line when a new order is created. We are building this new strategy upon the previously created SMASampleTrade.java file. Click here to learn more about adding objects to a chart.
At first, add the following imports:
import com.dukascopy.api.drawings.IChartObjectFactory;
import com.dukascopy.api.drawings.IOhlcChartObject;
import com.dukascopy.api.indicators.OutputParameterInfo.DrawingStyle;
import java.awt.Color;
import java.awt.Dimension;
import java.awt.Font;
We will use IChart and IChartObjectFactory objects to work with charts. So we create an instance parameter for each of them. As addition, we are creating one instance
parameter of integer type - we will need it later:
private IChart openedChart;
private IChartObjectFactory factory;
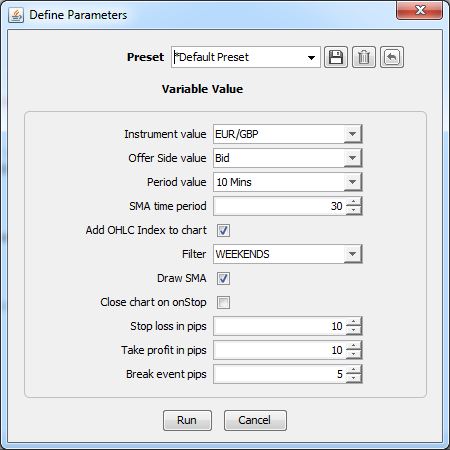
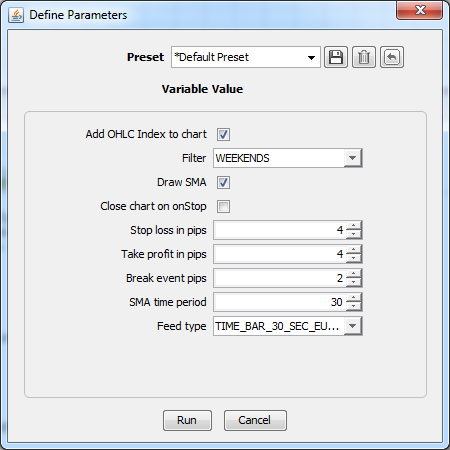
private int signals;When running the strategy, one will be able to choose whether to add or not the indicator and OHLC values to the chart, and whether or not to close the chart after the strategy is closed. So, add following parameters to the code:
@Configurable("Add OHLC Index to chart")
public boolean addOHLC = true;
@Configurable("Filter")
public Filter filter = Filter.WEEKENDS;
@Configurable("Draw SMA")
public boolean drawSMA = true;
@Configurable("Close chart on onStop")
public boolean closeChart;
Next, initialize the instance variables needed to add an SMA indicator to the chart and call a method (addToChart) which will do the job. The onStart method:
public void onStart(IContext context) throws JFException {
    this.engine = context.getEngine();
    this.console = context.getConsole();
    this.history = context.getHistory();
    this.context = context;
    this.indicators = context.getIndicators();
    this.userInterface = context.getUserInterface();
    //4.initialize the previously defined instance variables:
    this.openedChart = context.getChart(myInstrument);
    this.factory = openedChart.getChartObjectFactory();

    //subscribe an instrument:
    Set<Instrument> instruments = new HashSet<Instrument>();
    instruments.add(myInstrument);
    context.setSubscribedInstruments(instruments, true);

    //5.Check whether the user wants to add SMA indicator to the chart.
    //If yes, then executea addToChart method. addToChart method returns boolean value
    //if it can add an indicator to the chart. If it cannot add, then an error message is printed to the output
    if(drawSMA)
        if(!addToChart(openedChart)){
            printMeError("Indicators did not get plotted on chart. Check the chart values!");
        }
}
Modify the onStop method so it takes into consideration the users choice whether to close or not the chart if the strategy is going to close:
public void onStop() throws JFException {
    if(closeChart)
        context.closeChart(openedChart);
}
As an addition to the previously created logic, we will add to the chart an ISignalDownChartObject or ISignalUpChartObject object every time the onBar method is invoked for our instrument and period. Consider the following code in the onBar method:
public void onBar(Instrument instrument, Period period, IBar askBar, IBar bidBar) throws JFException {

if (!instrument.equals(myInstrument) || !period.equals(myPeriod)) {

return; //quit
}

int candlesBefore = 2, candlesAfter = 0;
previousBar = myOfferSide == OfferSide.ASK ? askBar : bidBar;
long currBarTime = previousBar.getTime();
double sma[] = indicators.sma(instrument, period, myOfferSide, IIndicators.AppliedPrice.CLOSE,
smaTimePeriod, Filter.NO_FILTER, candlesBefore, currBarTime, candlesAfter);
printMe(String.format("Bar SMA Values: Second-to-last = %.5f; Last Completed = %.5f", sma[SECOND_TO_LAST], sma[PREV]));

IEngine.OrderCommand myCommand = null;
printMe(String.format("Bar SMA Values: Second-to-last = %.5f; Last Completed = %.5f", sma[SECOND_TO_LAST], sma[PREV]));
if(sma[PREV] > sma[SECOND_TO_LAST]){
printMe("SMA in up-trend"); //indicator goes up
myCommand = IEngine.OrderCommand.BUY;
} else if(sma[PREV] < sma[SECOND_TO_LAST]){
printMe("SMA in down-trend"); //indicator goes down
myCommand = IEngine.OrderCommand.SELL;
} else {
return;
}

order = engine.getOrder("MyStrategyOrder");
if(order != null && engine.getOrders().contains(order) && order.getOrderCommand() != myCommand){
order.close();
order.waitForUpdate(IOrder.State.CLOSED); //wait till the order is closed
console.getOut().println("Order " + order.getLabel() + " is closed");
}
if(order == null || !engine.getOrders().contains(order)){
engine.submitOrder("MyStrategyOrder", instrument, myCommand, 0.1);
//7.we will draw an arrow when makeing an order.
//So we need a time of the current bar - to get it, we add one period of a bar to a time of the last completed bar (previousBar).
long time = previousBar.getTime() + myPeriod.getInterval();
//8.creating a IChartObject - an up-array or down-array and add a text label to the array.
//finally, add a IChartObject(array in this case) to the chart.
IChartObject signal = myCommand.isLong() ?
factory.createSignalUp("signalUpKey" + signals++, time, previousBar.getLow() - instrument.getPipValue()*2)
: factory.createSignalDown("signalDownKey" + signals++, time, previousBar.getHigh() + instrument.getPipValue()*2);
signal.setText(String.format("delta SMA %+.7f", sma[PREV] - sma[SECOND_TO_LAST]), new Font("Monospaced", Font.BOLD, 12));
openedChart.addToMainChart(signal);
}

}//end of onBar method
Add a new utility method for printing error messages to the strategy's output:
private void printMeError(Object o){
    console.getErr().println(o);
}
At last, implement the addToChart method. This method will add the SMA indicator and optionally the OHLC variables to the chart:
private boolean addToChart(IChart chart){
    if(chart == null){
        printMeError("chart for " + myInstrument + " not opened!");
        return false;
    }
    if (chart.getSelectedOfferSide() != this.myOfferSide) {
        printMeError("chart offer side is not " + this.myOfferSide);
        return false;
    }
    if (chart.getSelectedPeriod() != this.myPeriod) {
        printMeError("chart period is not " + this.myPeriod);
        return false;
    }
    if(chart.getFilter() != this.filter){
        printMeError("chart filter is not " + this.filter);
        return false;
    }

    chart.addIndicator(indicators.getIndicator("SMA"), new Object[] {smaTimePeriod},
            new Color[]{Color.GREEN}, new DrawingStyle[]{DrawingStyle.LINE}, new int[]{3});

    //if user has choosed to show the OHLC values, then add them to the chart:
    if(addOHLC){
        //If finds an existing ohlc object, then assign this object to the ohlc ref. variable
        IOhlcChartObject ohlc = null;
        for (IChartObject obj : chart.getAll()) {
            if (obj instanceof IOhlcChartObject) {
                ohlc = (IOhlcChartObject) obj;
            }
        }
        //if cannot find existing ohlc object, then create new one and assign to ohlc ref. variable
        if (ohlc == null) {
            ohlc = chart.getChartObjectFactory().createOhlcInformer();
            ohlc.setPreferredSize(new Dimension(100, 200));
            chart.addToMainChart(ohlc);
        }
        //show the ohlc index
        ohlc.setShowIndicatorInfo(true);
    }
    return true;
}//end of addToChart method
Here is the complete strategy's java file - ChartUsage.java.
Test the strategy with Historical Tester. Don't choose to close the chart on onStop method when testing with Historical Tester (it will show error messages), one should manually close the old chart before running a new test. In this example we are running our strategy with the following parameters:
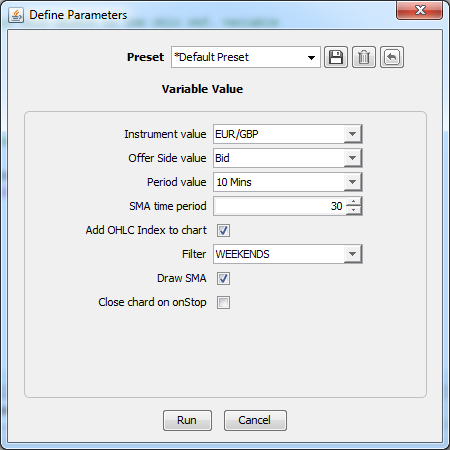
Here is a resulting chart:
Add Stop Loss and Take Profit
In this part of the tutorial we use stop-loss (SL) and take profit (TP) values of an order. We will modify the previously created strategy java file - ChartUsage.java
We begin by adding new imports and removing unnecessarily ones. Previously we assigned signal-up and signal-down objects to a IChartObject type, but now we will use another (more specific) reference type - IChartDependentChartObject. By using this kind of object one can indicate that the object will not stick to a bar when added to the chart (with IChartObject object type it is not possible).
import com.dukascopy.api.drawings.IChartDependentChartObject;
import com.dukascopy.api.drawings.ITriangleChartObject;
import com.dukascopy.api.drawings.ITextChartObject;
//2. Remove unneccesary imports
//import java.awt.Font;
Define new instance variables. We will need them later on:
private int uniqueOrderCounter = 1;
private SMATrend previousSMADirection = SMATrend.NOT_SET;
private SMATrend currentSMADirection = SMATrend.NOT_SET;
private Map<IOrder, Boolean> createdOrderMap = new HashMap<IOrder, Boolean>();
private int shorLineCounter;
private int textCounterOldSL;
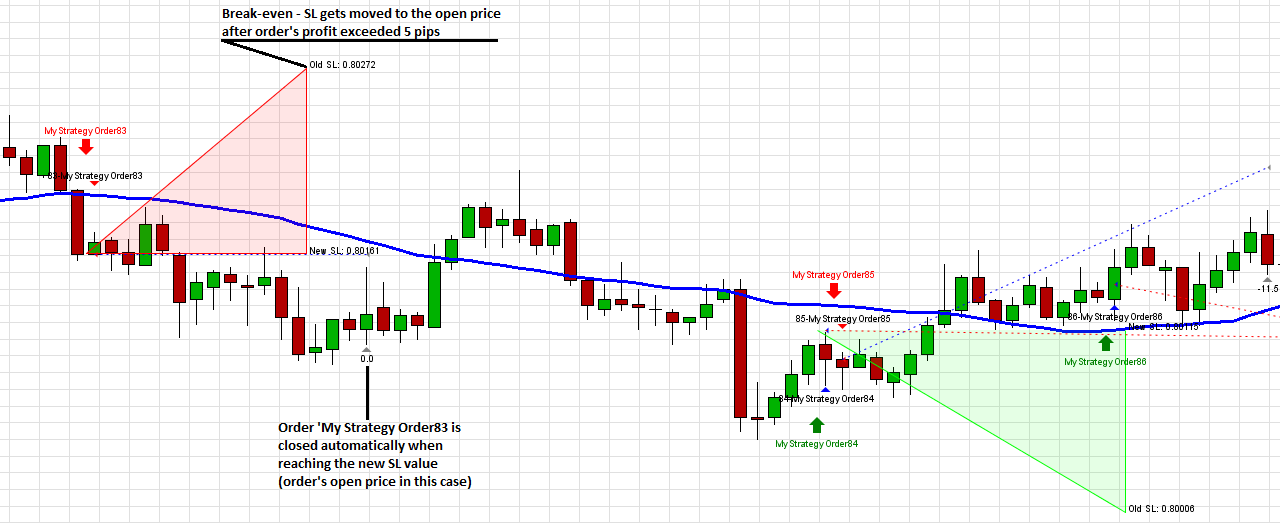
private int textCounterNewSL;As mentioned before, we are going to use SL and TP values of an order, so we add new parameters to be able to set the necessary values at the strategy's startup. The breakEventPips variable is used to set the level of profit-pips. When this level of profit in pips is reached, the order's SL value is set to the order's open-price level.
@Configurable("Stop loss in pips")
public int stopLossPips = 10;
@Configurable("Take profit in pips")
public int takeProfitPips = 10;
@Configurable("Break event pips")
public double breakEventPips = 5;
Define an enum which will hold constants of all possible SMA trend line states:
private enum SMATrend {
    UP, DOWN, NOT_SET;
}
Break Even in onTick
Consider the onTick method which gets called on every instrument's tick. We filter out only the instruments in which we are interested in, so the method is executed only when we need to. Later in the onBar method we add every new order to a Map object. Here we go through the Map of orders to see if we have already moved the SL according to the break-even level. If it is not changed, then we check if the profit in pips is greater than breakEventPips parameter. If it is, then we can change the SL value to the order's open price level. Every time the SL value is set to the open price, we add a triangle (by invoking a addBreakToChart method which is described later) to indicate the process visually on the chart. Finally we change the order's SL price and update the entry in the Map. Here is the implementation of onTick method:
public void onTick(Instrument instrument, ITick tick) throws JFException {
    if (instrument != myInstrument) {
        return;
    }
    for (Map.Entry<IOrder, Boolean> entry : createdOrderMap.entrySet()) {
        IOrder currentOrder = entry.getKey();
        boolean currentValue = entry.getValue();
        if (currentValue == false && currentOrder.getProfitLossInPips() >= breakEventPips) {
            printMe("Order has profit of " + currentOrder.getProfitLossInPips() + " pips! Moving the stop loss to the open price.");
            addBreakToChart(currentOrder, tick, currentOrder.getStopLossPrice(), currentOrder.getOpenPrice());
            //add a line to the chart indicating the SL changes
            currentOrder.setStopLossPrice(currentOrder.getOpenPrice());
            entry.setValue(true);
        }
    }
}//end of onTick method
Trade According to SMA
We modify our previously created onBar method. We are changing the onBar method in the way that it will use the SMATrend enum values to check when to create a new order. We are setting the SL and TP values, too. One difference from previous example is that we're not closing the previous order if a new one gets opened. The orders are closed automatically when the SL or TP values are reached. Plus, all new orders are saved in the Map for later checking in the onTick method.
public void onBar(Instrument instrument, Period period, IBar askBar, IBar bidBar) throws JFException {
    if (!instrument.equals(myInstrument) || !period.equals(myPeriod)) {
        return; //quit
    }

    int candlesBefore = 2, candlesAfter = 0;
    long completedBarTimeL = myOfferSide == OfferSide.ASK ? askBar.getTime() : bidBar.getTime();
    double sma[] = indicators.sma(instrument, period, myOfferSide, IIndicators.AppliedPrice.CLOSE,
            smaTimePeriod, Filter.NO_FILTER, candlesBefore, completedBarTimeL, candlesAfter);
    printMe(String.format("Bar SMA Values: Second-to-last = %.5f; Last Completed = %.5f", sma[SECOND_TO_LAST], sma[PREV]));

    IEngine.OrderCommand myCommand = null;
    printMe(String.format("Bar SMA Values: Second-to-last = %.5f; Last Completed = %.5f", sma[SECOND_TO_LAST], sma[PREV]));
    if (sma[PREV] > sma[SECOND_TO_LAST]) {
        printMe("SMA in up-trend"); //indicator goes up
        myCommand = IEngine.OrderCommand.BUY;
        currentSMADirection = SMATrend.UP;
    } else if (sma[PREV] < sma[SECOND_TO_LAST]) {
        printMe("SMA in down-trend"); //indicator goes down
        myCommand = IEngine.OrderCommand.SELL;
        currentSMADirection = SMATrend.DOWN;
    } else {
        return;
    }

    double lastTickBid = history.getLastTick(myInstrument).getBid();
    double lastTickAsk = history.getLastTick(myInstrument).getAsk();
    double stopLossValueForLong = myInstrument.getPipValue() * stopLossPips;
    double stopLossValueForShort = myInstrument.getPipValue() * takeProfitPips;
    double stopLossPrice = myCommand.isLong() ? (lastTickBid - stopLossValueForLong) : (lastTickAsk + stopLossValueForLong);
    double takeProfitPrice = myCommand.isLong() ? (lastTickBid + stopLossValueForShort) : (lastTickAsk - stopLossValueForShort);

    //if SMA trend direction is changed, then create a new order
    if (currentSMADirection != previousSMADirection) {
        previousSMADirection = currentSMADirection;
        IOrder newOrder = engine.submitOrder("MyStrategyOrder" + uniqueOrderCounter++, instrument, myCommand, 0.1, 0, 1, stopLossPrice, takeProfitPrice);
        createdOrderMap.put(newOrder, false);

        if(openedChart == null){
            return;
        }
        long time = bidBar.getTime() + myPeriod.getInterval(); //draw the  ISignalDownChartObject in the current bar
        double space = myInstrument.getPipValue() * 2; //space up or down from bar for ISignalDownChartObject
        IChartDependentChartObject signal = myCommand.isLong()
                ? factory.createSignalUp("signalUpKey" + signals++, time, bidBar.getLow() - space)
                : factory.createSignalDown("signalDownKey" + signals++, time, bidBar.getHigh() + space);
        signal.setStickToCandleTimeEnabled(false);
        signal.setText("MyStrategyOrder" + (uniqueOrderCounter - 1));
        openedChart.addToMainChart(signal);
    }

}//end of onBar method
Adding an Indicator to the Chart
Modify the addToChart method so that the chart-checking happens in a new method - checkChart:
private boolean addToChart(IChart chart) {
    if (!checkChart(chart)) {
        return false;
    }

    chart.addIndicator(indicators.getIndicator("SMA"), new Object[]{smaTimePeriod},
            new Color[]{Color.BLUE}, new DrawingStyle[]{DrawingStyle.LINE}, new int[]{3});

    if (addOHLC) {
        IOhlcChartObject ohlc = null;
        for (IChartObject obj : chart.getAll()) {
            if (obj instanceof IOhlcChartObject) {
                ohlc = (IOhlcChartObject) obj;
            }
        }
        if (ohlc == null) {
            ohlc = chart.getChartObjectFactory().createOhlcInformer();
            ohlc.setPreferredSize(new Dimension(100, 200));
            chart.addToMainChart(ohlc);
        }
        //show the ohlc index
        ohlc.setShowIndicatorInfo(true);
    }
    return true;
}//end of addToChart method
The method to check a chart:
private boolean checkChart(IChart chart) {
    if (chart == null) {
        printMeError("chart for " + myInstrument + " not opened!");
        return false;
    }
    if (chart.getSelectedOfferSide() != this.myOfferSide) {
        printMeError("chart offer side is not " + this.myOfferSide);
        return false;
    }
    if (chart.getSelectedPeriod() != this.myPeriod) {
        printMeError("chart period is not " + this.myPeriod);
        return false;
    }
    if (chart.getFilter() != this.filter) {
        printMeError("chart filter is not " + this.filter);
        return false;
    }
    return true;
}
Plotting a Break-even Triangle on the Chart
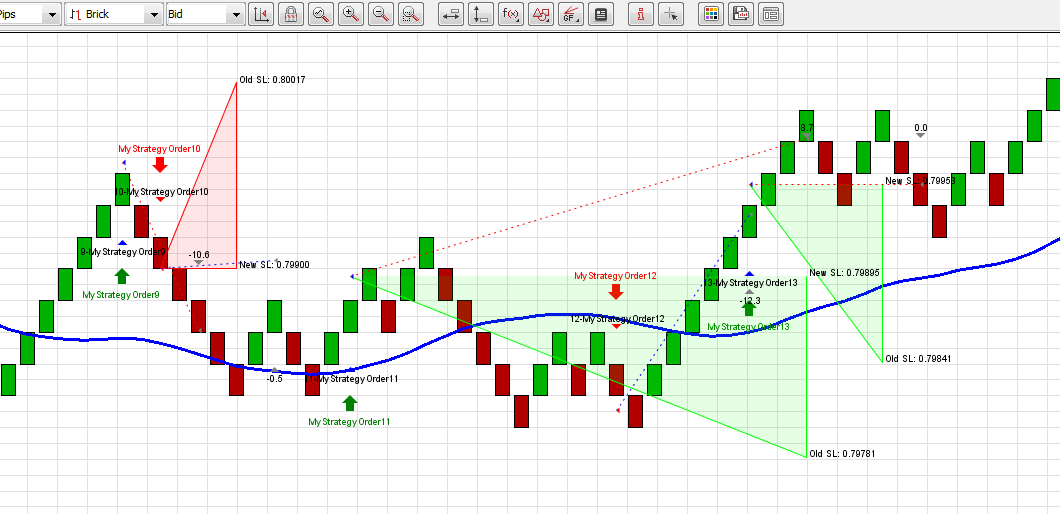
Implement the addBreakToChart method which is invoked from onTick method to show a visual representation of SL changes in the chart. In this method we are adding a triangle to our chart if the SL value is changed for an order. Green triangle represents the SL changes for long orders and red one for short orders. The triangle is drawn so that it starts when the order is created and ends when the SL value is changed. We add a text to the triangle to represent the old and new values of SL.
private void addBreakToChart(IOrder changedOrder, ITick tick, double oldSL, double newSL) throws JFException {
    if (openedChart == null) {
        return;
    }

    ITriangleChartObject orderSLTriangle = factory.createTriangle("Triangle " + shorLineCounter++,
            changedOrder.getFillTime(), changedOrder.getOpenPrice(), tick.getTime(), oldSL, tick.getTime(), newSL);

    Color lineColor = oldSL > newSL ? Color.RED : Color.GREEN;
    orderSLTriangle.setColor(lineColor);
    orderSLTriangle.setLineStyle(LineStyle.SOLID);
    orderSLTriangle.setLineWidth(1);
    orderSLTriangle.setStickToCandleTimeEnabled(false);
    openedChart.addToMainChart(orderSLTriangle);

    //drawing text
    String breakTextOldSL = String.format(" Old SL: %.5f", oldSL);
    String breakTextNewSL = String.format(" New SL: %.5f", newSL);
    double textVerticalPosition = oldSL > newSL ? newSL - myInstrument.getPipValue() : newSL + myInstrument.getPipValue();
    ITextChartObject textOldSL = factory.createText("textKey1" + textCounterOldSL++, tick.getTime(), oldSL);
    ITextChartObject textNewSL = factory.createText("textKey2" + textCounterNewSL++, tick.getTime(), newSL);
    textOldSL.setText(breakTextOldSL);
    textNewSL.setText(breakTextNewSL);
    textOldSL.setStickToCandleTimeEnabled(false);
    textNewSL.setStickToCandleTimeEnabled(false);
    openedChart.addToMainChart(textOldSL);
    openedChart.addToMainChart(textNewSL);
}
Here is the complete strategy's java file - StopLossStrategy.java.
Click here to learn more about SL.
Testing the Strategy
Run the strategy in the historical tester. In this example we're using following parameters:
Consider the output of the chart! Red and green arrows shows the short and long orders in the chart at a time the order is created. Right-side of the triangles shows the SL change time and the new and old SL values. Triangle's left corner starts at the same position in time when the order is created - by doing so one can easy track to which order the SL change is made for.
Using Data Feed
In this section we are going to change the feed data type from 10 minutes to 2-pip renko bars (and alternatively 30 second custom period bars) by leaving the remaining strategy logic the same. In order to create a strategy which works with different data feeds, one needs to create a class that implements a IFeedListener interface. This class needs to implement only one method - IFeedListener.onFeedData. This method is invoked every time the feed data arrives. In this example we are going to modify the previously created strategy java file - StopLossStrategy.java.
Declaration of a Feed Type
Modify the StopLossStrategy.java file and add following imports:
import com.dukascopy.api.IIndicators.AppliedPrice;
import com.dukascopy.api.feed.IFeedDescriptor;
import com.dukascopy.api.feed.IFeedListener;
import com.dukascopy.api.feed.util.RenkoFeedDescriptor;
import com.dukascopy.api.feed.util.TimePeriodAggregationFeedDescriptor;
As mentioned in the introduction, we need to implement the IFeedListener interface to retrieve feed data. We will implement the interface in the same class where the IStrategy interface is implemented:
public class Feeds implements IStrategy, IFeedListener {
    //class' implementation
}
If we are using more than one data-feed type in the code, then we need to use Instrument, OfferSide, PriceRange, Period according to a subscribed feed. All of these values can be retrieved from a IFeedDescriptor element. Replace these variables in all methods with calls of IFeedDescriptor methods which retrieve the same variables according to the feed type. So, remove the myInstrument, myOfferSide, and myPeriod parameters.
In this example we will provide a choice at strategy's startup to choose between two feed types, so we are add a new parameter. We will need to detect a user's choice of feed and subscribe it. Because of this we declare a new enum. This enum has a constructor that assigns a value for a constant's IFeedDescriptor variable. By doing so we can later use the enum's (FeedType) constant to get information about a selected data feed (Instrument, OfferSide, etc.).
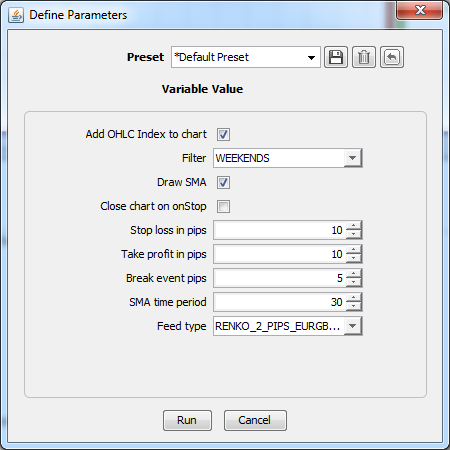
@Configurable("Feed type")
public FeedType myFeed = FeedType.RENKO_2_PIPS_EURGBP_BID;

public enum FeedType {

    RENKO_2_PIPS_EURGBP_BID (new RenkoFeedDescriptor(Instrument.EURGBP, PriceRange.TWO_PIPS, OfferSide.BID)),
    TIME_BAR_30_SEC_EURGBP_BID (new TimePeriodAggregationFeedDescriptor(Instrument.EURGBP, Period.THIRTY_SECS,
        OfferSide.BID, Filter.WEEKENDS));

    private final IFeedDescriptor feedDescriptor;

    FeedType(IFeedDescriptor feedDescriptor) {
        this.feedDescriptor = feedDescriptor;
    }
    public IFeedDescriptor getFeedDescriptor(){
        return feedDescriptor;
    }
}
Subscription to a Feed
We subscribe to a specific type of feed in the onStart method. We add the code that subscribes the feed:
public void onStart(IContext context) throws JFException {
    this.engine = context.getEngine();
    this.console = context.getConsole();
    this.history = context.getHistory();
    this.context = context;
    this.indicators = context.getIndicators();
    this.userInterface = context.getUserInterface();
    this.openedChart = context.getChart(myFeed.getFeedDescriptor().getInstrument());
    this.factory = openedChart.getChartObjectFactory();

    Set<Instrument> instruments = new HashSet<Instrument>();
    instruments.add(myFeed.getFeedDescriptor().getInstrument());
    context.setSubscribedInstruments(instruments, true);

    if (drawSMA) {
        if (!addToChart(openedChart)) {
            printMeError("Indicators did not get plotted on chart. Check the chart values!");
        }
    }
    //Subscribe to a feed:
    context.subscribeToFeed(myFeed.getFeedDescriptor(), this);
}
Implementation of a IFeedListener Interface
We are moving all logic from onBar to onFeedData method. We are no more interested in to execute the onBar method since we are using data feed. We are interested in that our logic is executed every time a new data arrives. To retrieve the data we need to implement IFeedListener interface. This interface declares only one method - onFeedData. One difference from the code of previously created strategy is that the Instrument and OfferSide values are retrieved from IFeedDescriptor object. All of the code is inserted in a try-catch block, because some of the methods (e.g. IIndicators.calculateIndicator) trow JFException. The IBar object is retrieved by casting down ITimedData object (IBar interface extends ITimedData interface). A feed of indicator is also retrieved in a little bit different manner - we are using IIndicators.calculateIndicator method instead of IIndicators.sma because of the usage of IFeedDescriptor object.
public void onFeedData(IFeedDescriptor feedDescriptor, ITimedData feedData) {

    Instrument myInstrument = feedDescriptor.getInstrument();
    OfferSide myOfferSide = feedDescriptor.getOfferSide();

    try {
        if(!(feedData instanceof IBar)){
            printMeError("Cannot work with tick feed data");
            return;
        }

        IBar bar = (IBar) feedData;

        int candlesBefore = 2, candlesAfter = 0;
        long completedBarTimeL = bar.getTime();

        Object[] smaObjectsFeed = indicators.calculateIndicator(feedDescriptor, new OfferSide[] { myOfferSide }, "SMA",
        new AppliedPrice[] { AppliedPrice.CLOSE }, new Object[] { smaTimePeriod }, candlesBefore, feedData.getTime(), candlesAfter);
        double[] sma = (double[]) smaObjectsFeed[0]; // sma has just 1 output

        printMe(String.format("Bar SMA Values: Second-to-last = %.5f; Last Completed = %.5f", sma[SECOND_TO_LAST], sma[PREV]));

        IEngine.OrderCommand myCommand = null;
        printMe(String.format("Bar SMA Values: Second-to-last = %.5f; Last Completed = %.5f", sma[SECOND_TO_LAST], sma[PREV]));
        if (sma[PREV] > sma[SECOND_TO_LAST]) {
            printMe("SMA in up-trend"); //indicator goes up
            myCommand = IEngine.OrderCommand.BUY;
            currentSMADirection = SMATrend.UP;
        } else if (sma[PREV] < sma[SECOND_TO_LAST]) {
            printMe("SMA in down-trend"); //indicator goes down
            myCommand = IEngine.OrderCommand.SELL;
            currentSMADirection = SMATrend.DOWN;
        } else {
            return;
        }

        double lastTickBid = history.getLastTick(myInstrument).getBid();
        double lastTickAsk = history.getLastTick(myInstrument).getAsk();
        double stopLossValueForLong = myInstrument.getPipValue() * stopLossPips;
        double stopLossValueForShort = myInstrument.getPipValue() * takeProfitPips;
        double stopLossPrice = myCommand.isLong() ? (lastTickBid - stopLossValueForLong) : (lastTickAsk + stopLossValueForLong);
        double takeProfitPrice = myCommand.isLong() ? (lastTickBid + stopLossValueForShort) : (lastTickAsk - stopLossValueForShort);

        //if SMA trend direction is changed, then create a new order
        if (currentSMADirection != previousSMADirection) {
            previousSMADirection = currentSMADirection;
            IOrder newOrder = engine.submitOrder("MyStrategyOrder" + uniqueOrderCounter++, myInstrument, myCommand, 0.1, 0, 1, stopLossPrice, takeProfitPrice);
            createdOrderMap.put(newOrder, false);

            if (openedChart == null) {
                return;
            }
            //get current time of a bar from IFeedDescriptor object
            long time = history.getFeedData(feedDescriptor, 0).getTime(); //draw the  ISignalDownChartObject in the current bar
            double space = myInstrument.getPipValue() * 2; //space up or down from bar for ISignalDownChartObject
            IChartDependentChartObject signal = myCommand.isLong()
                    ? factory.createSignalUp("signalUpKey" + signals++, time, bar.getLow() - space)
                    : factory.createSignalDown("signalDownKey" + signals++, time, bar.getHigh() + space);
            signal.setText("MyStrategyOrder" + (uniqueOrderCounter - 1));
            openedChart.addToMainChart(signal);
        }
    } catch (Exception e) {
    }
}
The onBar method remains with empty body:
public void onBar(Instrument instrument, Period period, IBar askBar, IBar bidBar) throws JFException { }Modification of the Chart-checking Method
In the chart-checking method we replace the manner of getting Instrument and OfferSide objects. We are using IFeedDescriptor object to retrieve them. The logic of checking the chart is also a little bit different from the previous one. We need to detect the type of data-feed and verify the chart according to it:
private boolean checkChart(IChart chart) {
    if (chart == null) {
        printMeError("chart for " + myFeed.getFeedDescriptor().getInstrument() + " not opened!");
        return false;
    }
    if (chart.getSelectedOfferSide() != myFeed.getFeedDescriptor().getOfferSide()) {
        printMeError("chart offer side is not " + myFeed.getFeedDescriptor().getOfferSide());
        return false;
    }

    if(chart.getFeedDescriptor().getDataType() == DataType.RENKO){
        if (chart.getPriceRange() != myFeed.getFeedDescriptor().getPriceRange()) {
            printMeError("chart price range is not " + myFeed.getFeedDescriptor().getPriceRange());
            return false;
        }
    } else if (chart.getFeedDescriptor().getDataType() == DataType.TIME_PERIOD_AGGREGATION){
        if(chart.getSelectedPeriod() != myFeed.getFeedDescriptor().getPeriod()){
            printMeError("chart period is not " + myFeed.getFeedDescriptor().getPeriod());
            return false;
        }
    }

    if (chart.getFilter() != this.filter) {
        printMeError("chart filter is not " + this.filter);
        return false;
    }
    return true;
}
The complete source code of the strategy - Feeds.java.
Testing the Strategy
In this example we are using more specific time (30 seconds) and price (2 pips) ranges. Before launching the strategy one needs to open a chart with the same parameters as given in the strategy parameters. To add specific ranges of time/price ranges one needs to choose Tools -> Preferences -> Period and add required periods. To launch the strategy you need to add Renko 2 Pips and 30 Seconds periods.
Testing with a Renko Feed
We are running the test of Renko 2 Pips with following parameters:
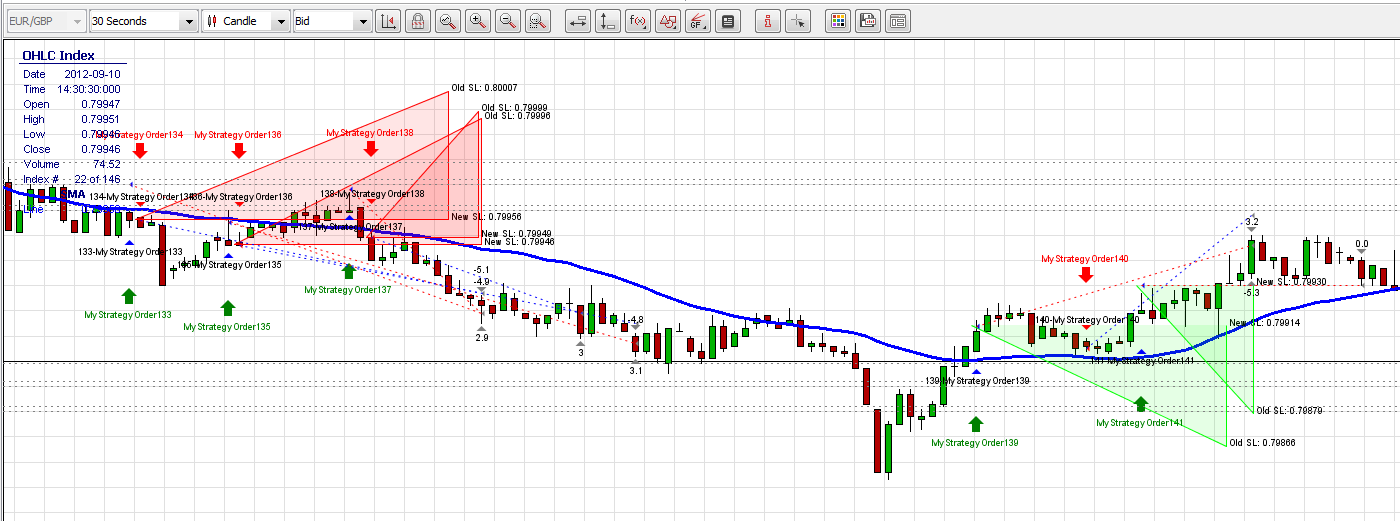
Here is an example picture of results of Renko (2 pips) feed type. We can see that the SMA indicator and long/short orders are added to the chart:
Testing with a Custom Period Candle Feed
When testing Time Bar 30 second feed, we are using smaller Stop Loss and Break Event pips because with the larger values it would be hard to track the SL changes (plotted triangles would be very wide). Used parameters:
Results:
Adding GUI to Strategy
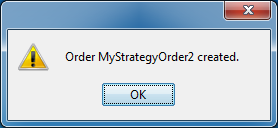
In this example we are adding a GUI (Graphical User Interface) element (JDialog) which will show up a warning dialog every time a new order is submitted. The dialog will contain the message text with a label of the created order. If it happens that the new order is created before the old dialog is closed, then the dialog simply changes the new order's label in the message text.
We will modify our previously created strategy - Feeds.java.
At first, we're adding new imports for GUI. We are going to use a JDialog object, that will include (wraps) JOptionPane (the content of JDialog) object.
import java.awt.event.ComponentAdapter;
import java.awt.event.ComponentEvent;
import javax.swing.JDialog;
import javax.swing.JOptionPane;
import javax.swing.SwingUtilities;
Declare instance variables for the dialog.
private boolean dialogClosed = true;
private JOptionPane optionPane = new JOptionPane(null, JOptionPane.WARNING_MESSAGE);
private JDialog dialog = optionPane.createDialog(null, null);
By default the dialog would block an access to the platform while the dialog is in open state. To make the dialog not modal, add the following line of code to the onStart method:
dialog.setModal(false);To show a dialog we call a showNotification method from onDataFeed method. Call for the showNotification method if a new order is created. Here is a code snippet:
// ..
if (currentSMADirection != previousSMADirection) {
    previousSMADirection = currentSMADirection;
    IOrder newOrder = engine.submitOrder("MyStrategyOrder" + uniqueOrderCounter++, myInstrument, myCommand, 0.1, 0, 1, stopLossPrice, takeProfitPrice);
    createdOrderMap.put(newOrder, false);

    //invoke the method that will show up a dialog
    SwingUtilities.invokeLater(new Runnable(){
        public void run(){
            showNotification();
        }
    });
//..
The showNotification method shows the dialog every time a new order is created (if the old dialog is closed) or modifies the message of an existing dialog (if the old dialog is not closed). If the dialog is not closed, then the method adds a logic which listens to dialog's events. In this case we are listening for window's close events. If the window of dialog gets closed then the dialogClosed variable is set to false, so at the next method's execution we will now that the dialog is in closed position.
private void showNotification(){
    String message = "Order MyStrategyOrder" + (uniqueOrderCounter -1) + " created.";

    if(dialogClosed){
        dialog.addComponentListener(new ComponentAdapter() {
            public void componentHidden(ComponentEvent e){
                dialogClosed = true;
            }
        });
        optionPane.setMessage(message);
        dialog.setVisible(true);
        dialogClosed = false;
    } else {
        optionPane.setMessage(message);
        dialog.validate();
    }
}
Here is the completed strategy's java file - FeedsGUI.java.
When running the strategy, a new warning dialog appears. If we close the dialog, then at the next order submission a new dialog appears. If we don't close the dialog before the new order is submitted, then the message of the dialog is changed. The dialog should look like the following one:
One can click here to learn more of how to use JDialog and other Java™ swing objects.