What's new?
Version 4.8.16
Available since 8.Jul 2026
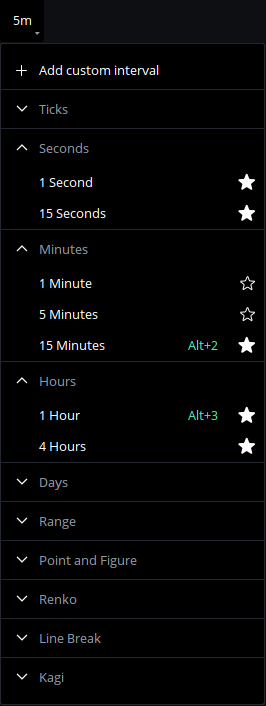
Interval switch menu
A scrollbar has been added to the Interval Switch menu in charts.
Version 4.8.15
Available since 8.Jul 2026
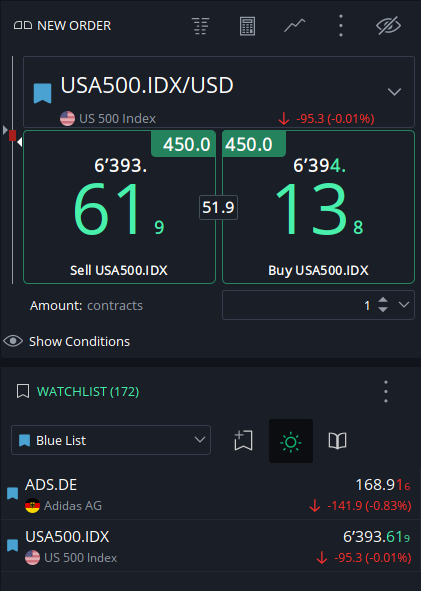
Improved Order preview
The Order Preview dialog now displays Estimated Profit/Loss and distance to market, giving you a clearer picture of your trade before you place it.
Custom intervals
A new dialog has been introduced for managing custom intervals. The previously dedicated section in Preferences has been removed.
Version 4.8.14
Available since 22.May 2026
Toast notifications
Notifications are now displayed as toast notifications in the Windows operating system.
Version 4.8.13
Available since 22.May 2026
Chart intervals
Introducing a new menu for chart interval switching.
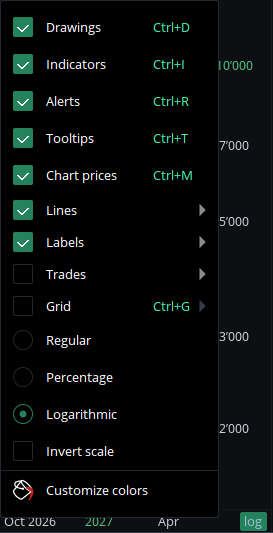
Logarithmic scale
Added logarithmic scale support for charts.
Anchored VWAP
New drawing tool: Anchored VWAP — pin your volume-weighted average price to any bar and track dynamic support and resistance from that point forward.
Version 4.8.12
Available since 22.May 2026
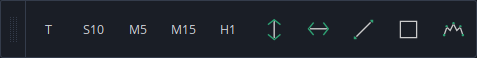
Chart intervals
Chart intervals and chart type selection are now presented in a more compact layout.
Version 4.8.11
Available since 03.Mar 2026
Import
Fixed an issue with Workspace and Chart Template import.
Version 4.8.10
Available since 03.Mar 2026
Strategies
Issues with strategies fixed on MAC OS.
Comments
Synchronized the Comments field for Positions and Orders between the GUI and Strategies.
Version 4.8.5
Available since 03.Mar 2026
JCloud
JCloud linkage settings have been moved to the Preferences dialog.
Version 4.8.2
Available since 03.Mar 2026
Lock mode
The price scale is no longer locked automatically when switching chart intervals.
Crosshair
Crosshair snapping to OHLC prices now depends on the Snap to Candles option. This option can be toggled in the chart toolbar or temporarily enabled by holding the Ctrl key (Command on macOS).
Visual JForex
Support for Visual JForex as a service has been discontinued.
Major release 4.8.1
Available since 03.Mar 2026
Charts load up to 6× faster
We’ve significantly improved chart data loading. Charts can now load up to 6 times faster than before.
Switch between sub-accounts
Users with LIVE sub-accounts can now switch between them directly inside the platform.
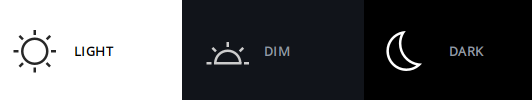
New Dim theme
A new Dim theme is now available, along with visual improvements to the existing Dark and Light themes.
Adjustable font weight
You can now change the font weight. Enable Bold text from Settings.
JCloud integration
To improve synchronization across devices, we’ve updated the interface to better support saving files in JCloud.
This applies to:
- Workspaces
- Chart templates
- Strategies
- Indicators
Content stored locally must now be imported into JCloud before use. For this purpose, Import and Export options have been added to the Workspace and Chart Templates menus.
Improved time scale
Chart time scales now display both the date and the day of the week. Major dates are highlighted in a different color to improve visibility.

Angled text labels
Text labels are now displayed at an angle for the following drawing tools:
- Trend line
- Rectangle
- Rotated rectangle
- Channel lines
- Fibonacci channel
Simplified chart themes
There is now a single default chart theme that automatically adapts to the platform theme and price direction colors.
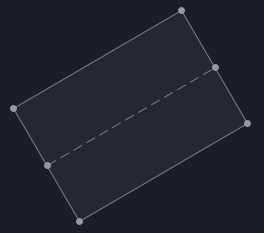
New drawing tool: Rotated Rectangle
A new Rotated Rectangle drawing tool has been added to charts.
Historical data start marker
The start of historical price data is now marked with a vertical line on charts.
Snap to candle toggle
Hold Ctrl (Command on MAC OS) to temporarily toggle snapping:
- If snapping is off, holding Ctrl snaps drawings to OHLC prices
- If snapping is on, holding Ctrl disables snapping
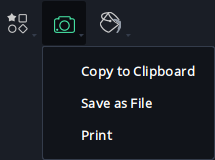
Chartshots update
The Chartshots menu has been moved to a new toolbar button for easier access.
Version 4.7.0
Available since 7.Nov 2025
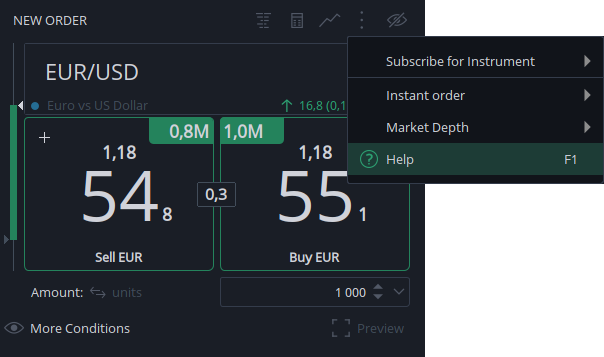
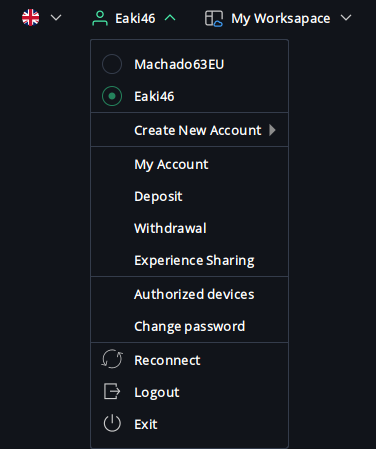
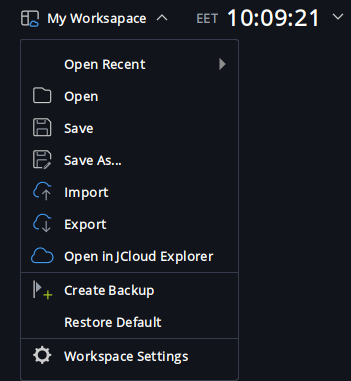
Main menu
File, Workspace and Account sections are now in the custom menu on the right.

Market depth
Hover over the buttons to see the required liquidity in Market Depth for Market orders.

Version 4.6.18
Available since 11.Sep 2025
Sorting in Watchlist
Sorting has been improved in Watchlist.
Editable cells
Some cells in the Positions, Orders and Alerts tables are editable. Hover over a cell to display buttons for editing or canceling/removing.
Version 4.6.17
Available since 22.Aug 2025
Minor bugs fixed.
Version 4.6.16
Available since 22.Aug 2025
Price colors
You can now display price movements in different colors. Right-click and choose between Fixed or Dynamic price colors in the menu.
Step line
Step line is available for indicators as well now.
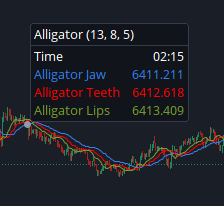
Output colors
Indicator outputs are shown in their colors in tooltip.
Version 4.6.14
Available since 22.Aug 2025
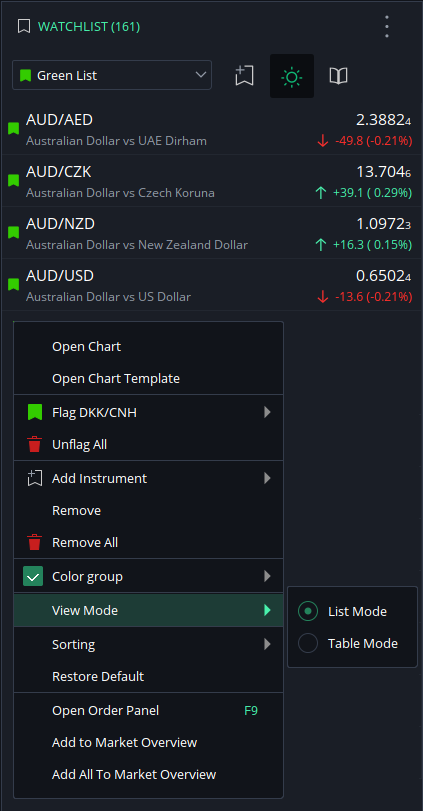
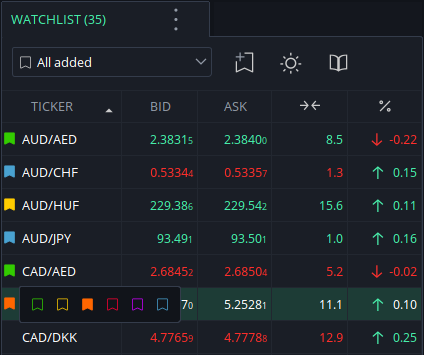
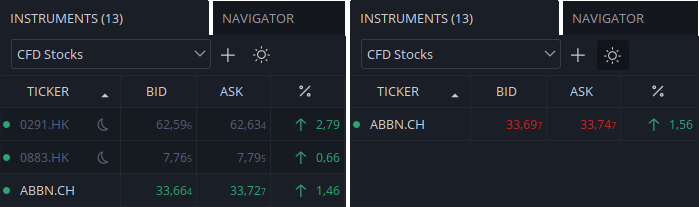
New mode in Watchlist
Watchlist has 2 modes now:
- List mode
- Table mode
New List mode shows:
- symbol
- description
- current Best Bid
- daily change (absolute and as %)
The mode can be switched in menu.
Version 4.6.13
Available since 10.Jul 2025
Expand/Collapse in Navigator
Expand/Collapse buttons have been added in Navigator.
Version 4.6.12
Available since 10.Jul 2025
Sidebar on MAC
Sidebar can be hidden on MAC as well now.
Version 4.6.11
Available since 10.Jul 2025
Sidebar
Introducing the Sidebar for easy toggling.
You can disable it in the main menu via the dedicated button.

Version 4.6.9
Available since 10.Jul 2025
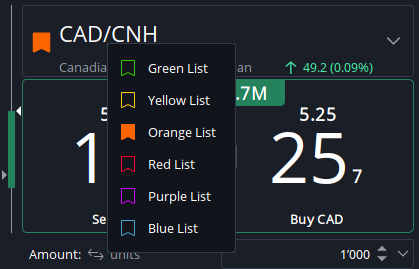
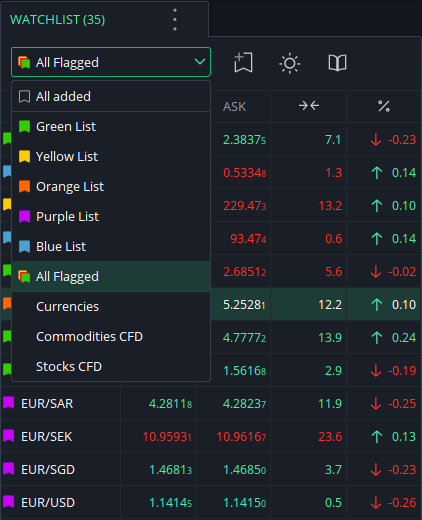
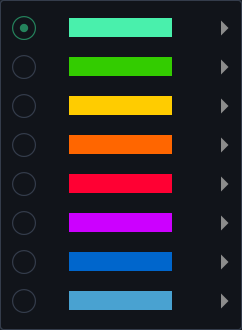
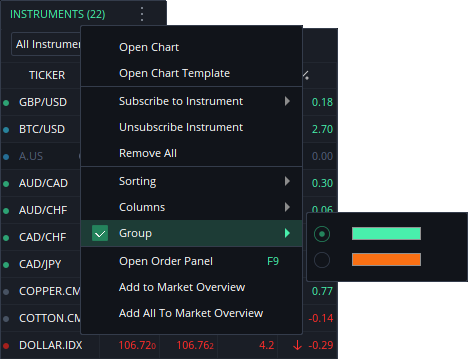
Flagged lists
You can now create custom lists of instruments!
Flags of different colors can be assigned to any instrument added to the Watchlist (formerly called Instruments).
CVD Indicator
The logic of the Cumulative Volume Delta indicator has been fixed.
Risk/Reward settings
Risk/Reward tool settings are now properly saved in templates.
Version 4.6.7
Available since 28.Apr 2025
Indicator dialog redesigned
Add indicator dialog has been completely redesigned with the following features added:
- list of favorites
- localization in several languages
- a short description of each indicator on mouse hover
- possibility to add several indicators at once
- possibility to edit the indicators, which source code is available

Quick search from chart has also been improved.
Version 4.6.6
Available since 28.Apr 2025
New chart types
Please welcome new chart line types:
- Line with markers
- Step line
Version 4.6.5
Available since 28.Apr 2025
New chart types
We have added 2 new chart types:
- Volume candles
- Heikin Ashi
Volume candles were available if a setting of time scale was switched, which was hard to find. This setting has been removed now.
Heikin Ashi was available as an indicator only.
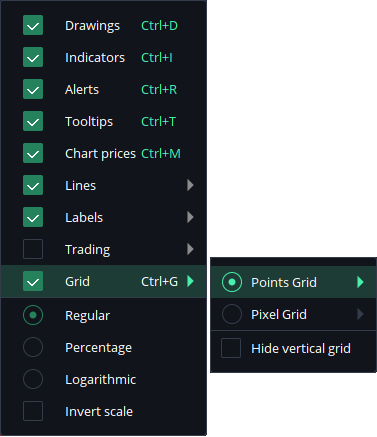
Grid settings
The grid settings have been moved from global to individual level of each chart. This allows setting different grid settings on each chart as the price of each asset can be very different.
Version 4.6.0
Available since 27.Mar 2025
Hotfix
Fixed issues with report and properties dialog of Strategy Tester.
Major release 4.5.2
Available since 27.Mar 2025
Java 21
We have built this version on Java 21st, which means we no longer support the platform for Operating Systems on 32-bit architecture.

Custom title bar on MAC
Platform on MAC has custom title bar now, where we display information and show our custom buttons.
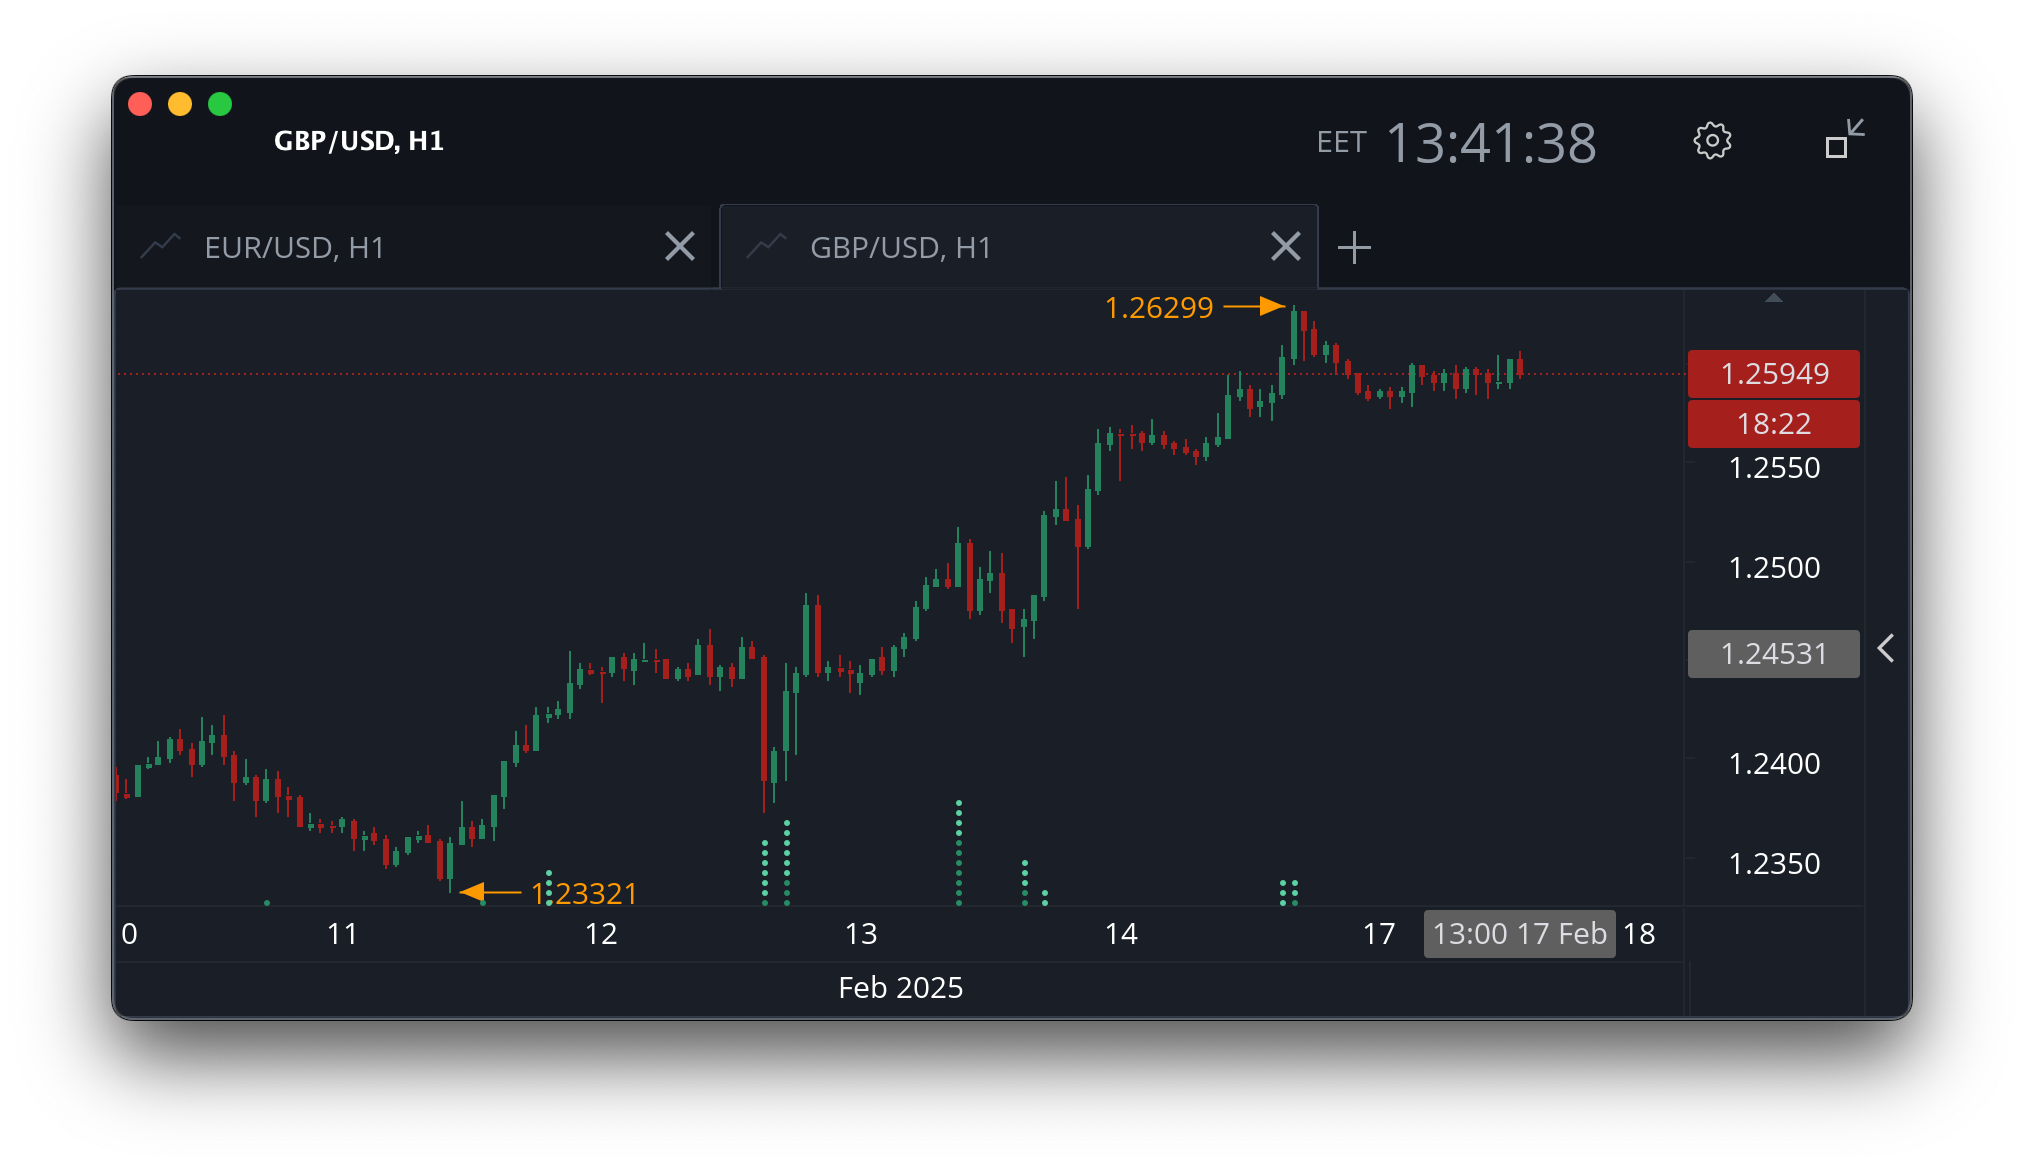
Objects snapping
Objects snapping to OHLC price data has been moved from individual level of the object to global level in each chart. A dedicated button has been added in toolbar.
Order lines are snapping as well now, if this mode is enabled.
Chart grid
Chart grid and the labels on time scale have been placed at the center of each candlestick now.

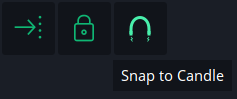
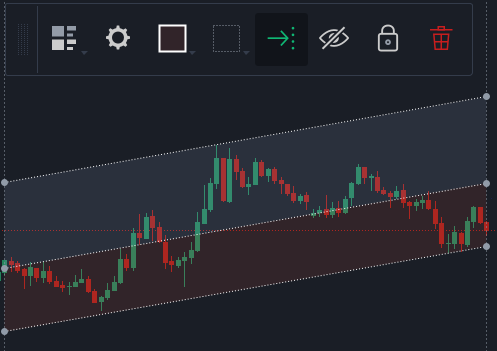
Linear Regression Channel
Linear Regression channel is added to the drawings.
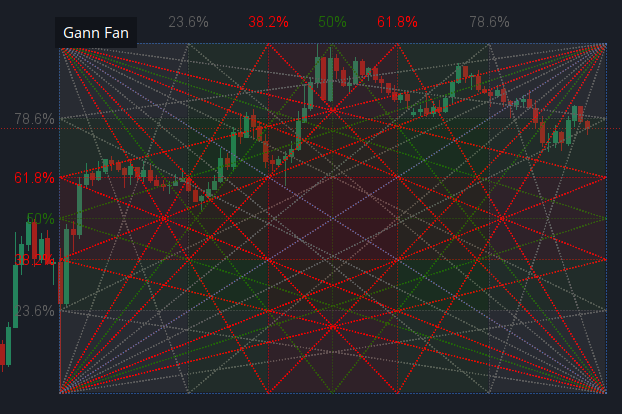
Gann Box
Gann Box has joined our drawings list.
Candlestick
Candlestick object can now be extended to the current candle automatically.
This object can be found under Drawings section in toolbar.
Hotlists of currencies
Besides the hotlists of CFDs on Stocks, there are lists of Currency pairs as well now.
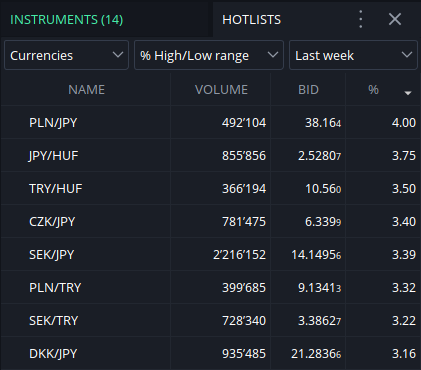
Top 10 gainers and loosers are shown based on the price changes or high/low range. The members of the list are updated each 5 minutes.
Default trading values
The Default trading values section in Preferences has been slightly improved.
Order confirmation
If One-click mode is disabled, the orders edited using Drag and Drop in chart need to be confirmed as well.
Order comments
Order comments are displayed in Replay mode now.
Issues with Cmd+ in MAC
Cmd+ and Ctrl+ commands work with text objects in MAC now.
Version 4.4.11
Available since 22.Nov 2024
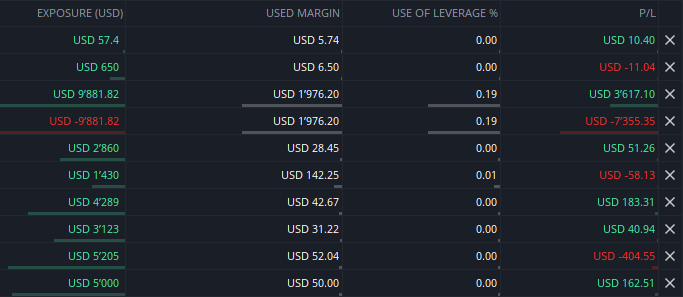
Use of leverage
New column has been added in Summary. It shows Use of leverage for every instrument in which the position is open.
Values as %
The values in Summary, Positions and Orders tables can be displayed as percentage visually. New toggle button has been added in the menu.
Version 4.4.10
Available since 31.Oct 2024
Minor fixes.
Version 4.4.9
Available since 31.Oct 2024
Minor fixes.
Version 4.4.8
Available since 15.Oct 2024
Improved Volume Profile
It is possible to enable VAL and VAH lines in Volume profile now.
Dock to main frame
Dock to main frame button has been added in custom title bar.
Version 4.4.6
Available since 30.Sep 2024
Improving chart themes
Chart themes dialog has been simplified and improved.
Objects in chart
The overall amount of chart objects is displayed in Objects manager. User can manage them when cloning the chart or switching from local mode to JCloud mode.
Version 4.4.4
Available since 21.Aug 2024
Parameters widget
It is possible to hide the widget of the Drawings parameters. Right click to hide it in the menu or search for it in Preferences/Chart settings/Drawings settings.
Selection on new object adding
There is a new setting in Preferences/Chart settings/Drawings settings called "Select after adding new" , which disables the newly drawn object automatic selection. This reduces the amount of clicks in case many objects need to be drawn.
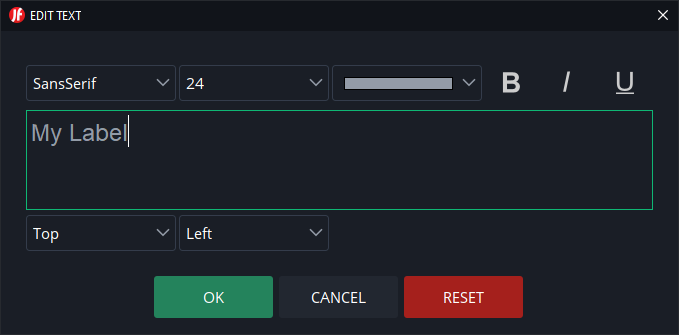
Text label
Text label has been improved. It is possible to Copy/Paste the text inside it now.
Warnings about indicator settings
Warnings related to indicator settings, due to which they cannot be displayed, are shown now in Objects manager and sub-pane headers. Hover the mouse cursor to read the reason.
Risk/Reward tool
Risk/Reward tool has been improved. There are more settings available now.
Base period
Automatic detection of the Base period can be disabled now in the settings of the indicator. Base period is available for unstable period indicators and VOLUME_PROFILE only.
Version 4.4.3
Available since 15.Jul 2024
Text label
Fixed issues with text label editing in chart.
Major release 4.4.1
Available since 5.Jul 2024
CPU usage on reconnect
We have optimized the CPU usage in case of reconnection.
Instruments manager
A new window has been added to help finding the instruments.
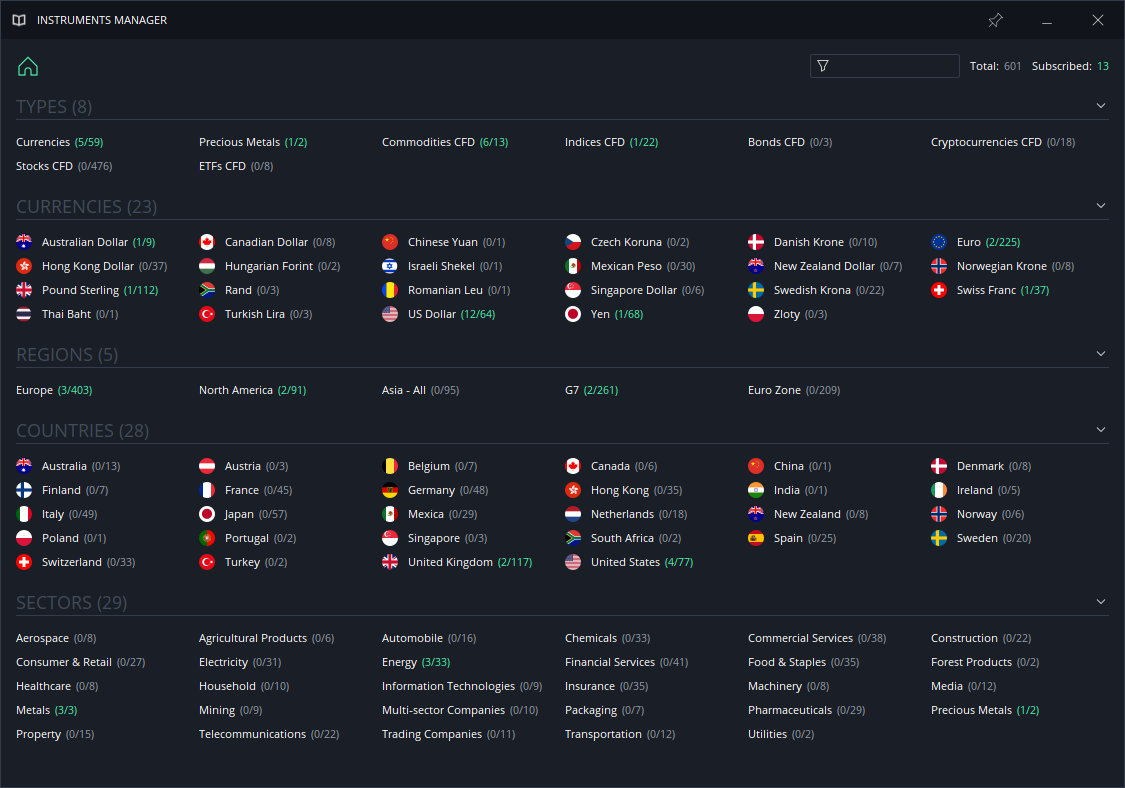
You can find it in the Instruments panel.
New setting in Replay mode
We have added new setting in Replay mode: Data settings.
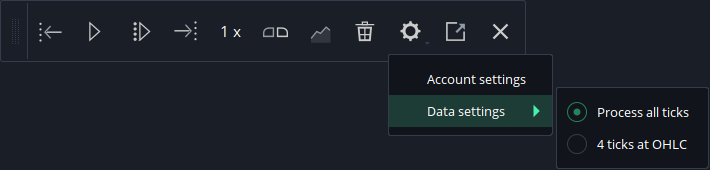
Process all ticks
All the historical price movements are processed, therefore it is possible to switch to longer time periods in chart and get back to the shorter period without moving in time. The drawback is a slower performance and more data needed.
4 ticks at OHLC
The mode where each candlestick is split into 4 ticks - Open, High, Low and Close. The replay is very fast, but switching to longer periods causes jump in time, which is an issue, when returning back to the shorter periods.
Saved data in Replay mode
Objects and trading results of the Replay are saved. The replay can be continued after platform restart.
Lines of Indicators
A new setting has been added in Preferences/Chart settings/General settings: Show lines of current values of indicators.
If disabled, the horizontal lines showing the last values of the indicators are hidden.
Version 4.3.11
Available since 13.Jun 2024
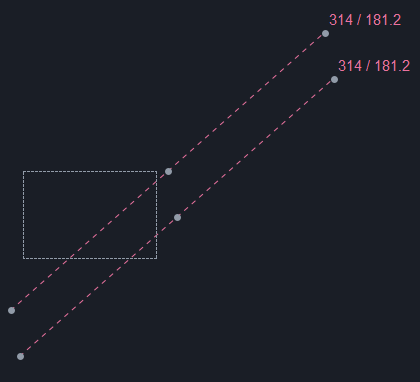
Highlight all drawings when moved
We have added new setting in Preferences/Chart settings/Drawing settings. If enabled, the dots on all the drawings are shown, when any drawing is moved.
This is convenient if the object needs to be moved where the coordinates of the other objects are.
Version 4.3.10
Available since 7.Jun 2024
Multi-selection
Chart drawings can be multi-selected with the mouse right click and drag. This feature can be disabled in Preferences/Charts/Drawing settings.
Cloning
Chart drawings can be cloned more conveniently now. The objects get cloned by pressing Ctrl + mouse left click on Windows or Linux OS or Cmnd (meta key) + mouse left click on MAC OS.
Version 4.3.9
Available since 31.May 2024
Items in Favorites
Items in Favorites widget can be managed on right click on widget now. Icons can be added there as well.
Hot keys for Icons
Hot keys can be assigned for each Icon in Preferences.
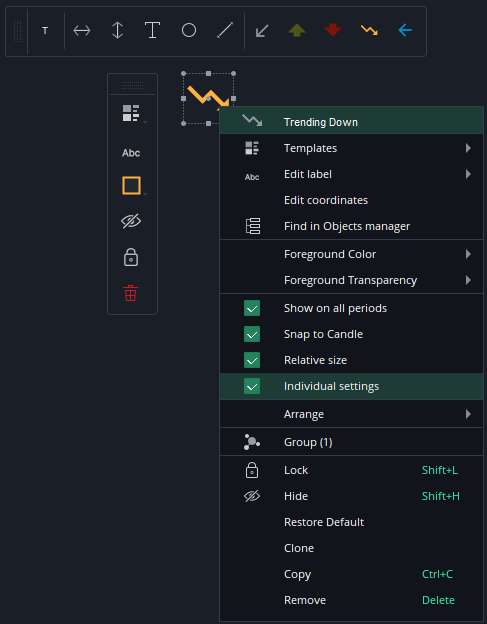
Relative size of Icons
Icons drawn in chart can be of relative size now, which means their size will be adjusted on zoom in/out. The setting can be found in context menu.
Individual settings for Icons
Parameters like color, size and transparency of the Icons can be saved individually. This is convenient if e.g. arrows need to be colored differently.
Besides, the color is also shown in Favorites widget, if the Icons are added there.
Drawings moving
Drawings can be moved without the need to select them first, if the new setting "Select drawings before moving them" is disabled. It can be found in Chart settings.
Unlock chart objects
In case chart drawing is locked, there is a button shown on mouse hover, which can be used to unlock it.
Version 4.3.7
Available since 31.May 2024
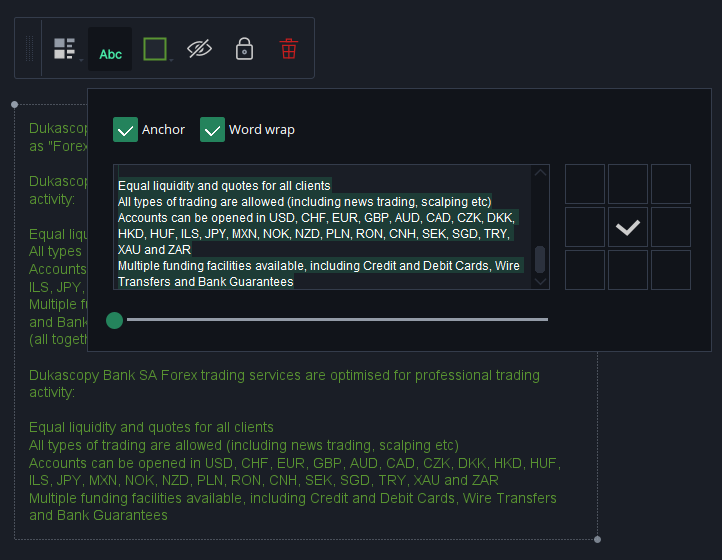
Text label
Text object in chart has been improved. The text can be wrapped now and the width of the object can be adjusted.
Lines in chart theme
There is a new section added in Chart themes: Lines.
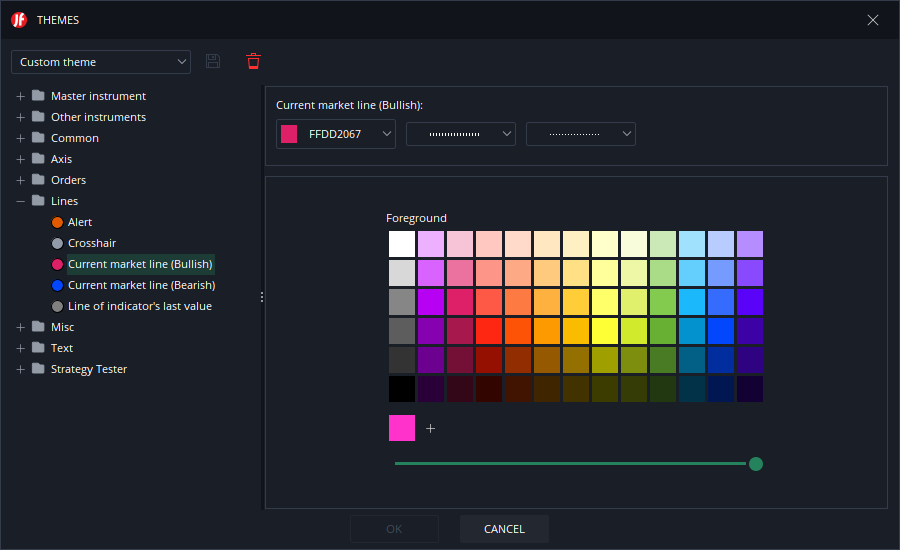
It contains the line color, style and width of the:
- Alerts
- Crosshair
- Current market price, if the last candle is bullish
- Current market price, if the last candle is bearish
- Line of the indicator's last value.
Version 4.3.4
Available since 31.May 2024
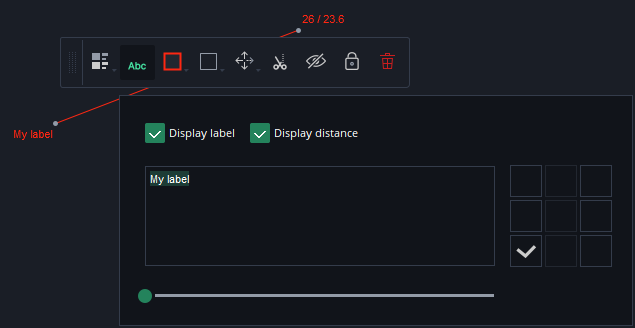
Text label in widget
The chart objects can be labeled from the widget now. The label is inheriting the foreground color from the object itself.
Text
Text object in chart has been combined with Screen label.
In order to fix its position on the chart, use the Anchor setting in the panel.
Version 4.3.2
Available since 31.May 2024
Rotation of the icons
The icons added to the chart can be rotated now.

Lines of the alerts in sub-panes
The alerts set on indicators, which reside in sub-panes are shown now.
Labels saved in templates
The chart objects labels are saved in their templates now.
Major release 4.3.1
Available since 31.May 2024Custom titlebar
We have implemented custom title bar on Windows OS.
We have added Preferences button there and clock on every chart.

Some of the functions have moved down to the status bar of the main frame.

Sub-panes of indicators
The sub-panes of indicators have been redesigned.
They can be expanded/collapsed, moved up/down and assigned to different color groups of the charts. For example, an indicator assigned to the yellow color group will not be shown on the chart of the red group.
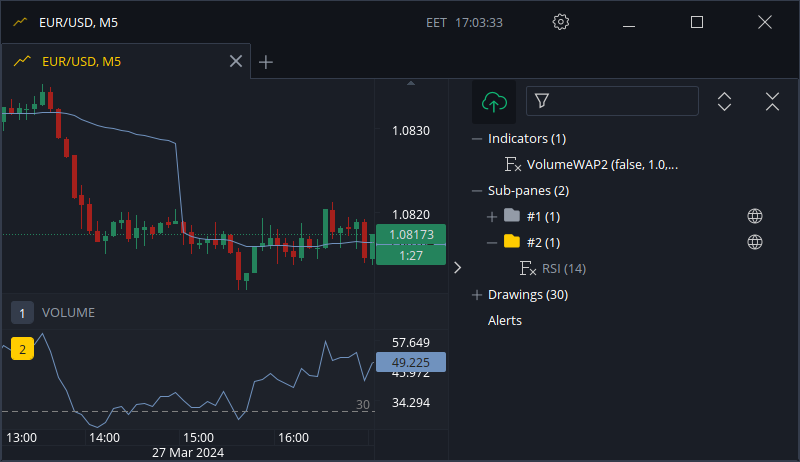
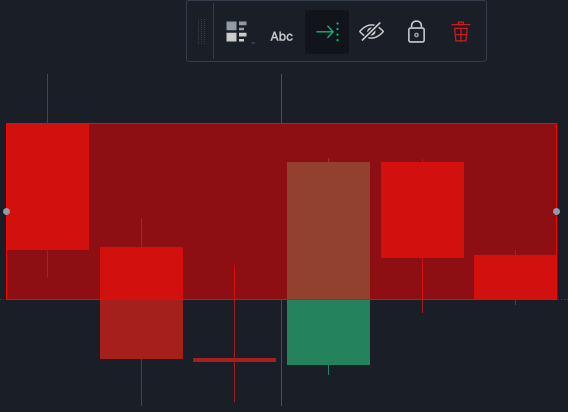
Chart objects widget
We have added a new widget in charts for easier access of the most popular parameters of:
- Drawings
- Patterns
- Retracement tools
- Icons
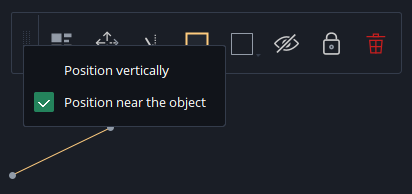
Right click the widget to enable its positioning near each object or move it to a certain place.
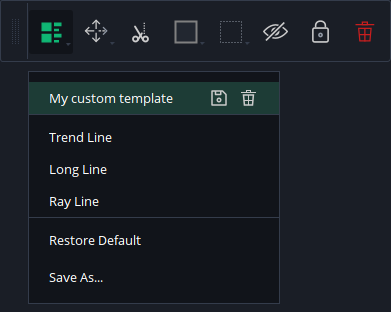
Templates of Chart objects
Users are able to create their custom templates for drawings, patterns and retracement tools in this version. Use them to save different parameters of the objects and switch them easily.
Some of the objects e.g. Trend line (ex. Short line) have built-in templates. They can be removed if necessary.
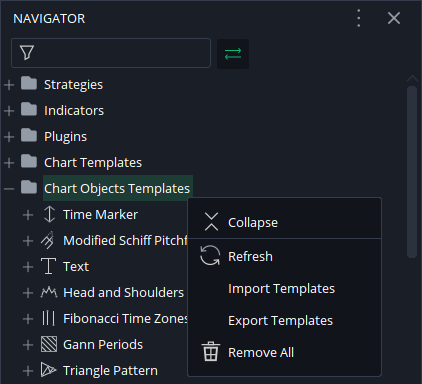
The chart objects templates are displayed in Navigator as well. Besides saving them in workspace, they can be exported and imported if needed. This is helpful if they need to be moved from one existing workspace to the other.
Icons
New objects - icons, can be added in the charts now.
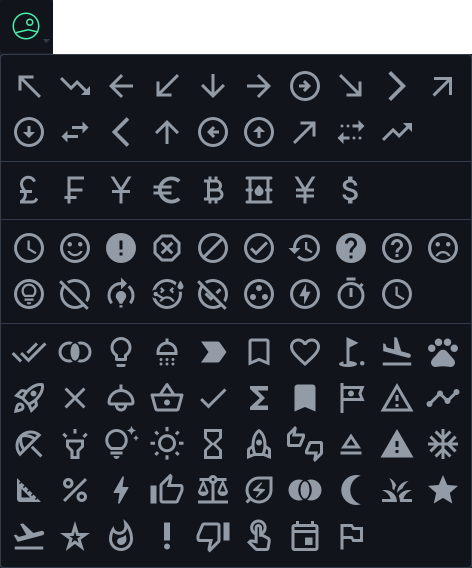
We will add the rotation function in the following versions.
Risk/Reward tool
A new tool Risk/Reward is available in chart.
It displays an estimated outcome of the Long or Short position given the entry level, Take profit, Stop loss and the entry/exit time.
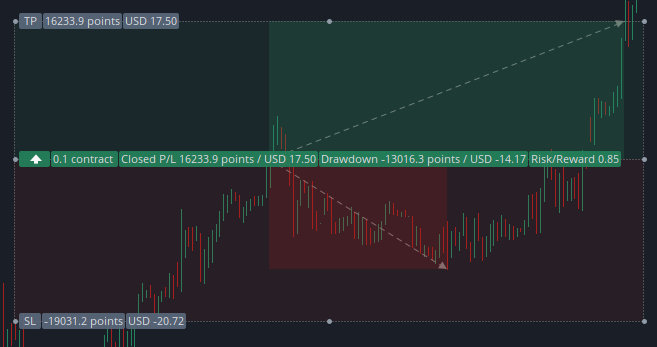
This object has several settings, including display of the Drawdown (maximum loss) and Run-up (maximum profit).
Risk/Reward tool can be found under Drawings section in chart toolbar.
Trend line
We have combined 3 old drawing objects - Short line, Long line, Ray line into one new object Trend line, which can be expanded in both directions to achieve the look of the old objects.
Middle line of Rectangle
The middle line of the Rectangle can be enabled in the context menu.
Reorganized levels
The dialog of the levels editing for the retracement tools has been reorganized.
Custom colors
The dialog of the custom colors has been reorganized and improved. It is possible to save up to 12 colors.
Find alerts in chart
We have made it possible to find the time of the price alert completion in chart in this version. User can use the button in Alerts table or pop-up notification.
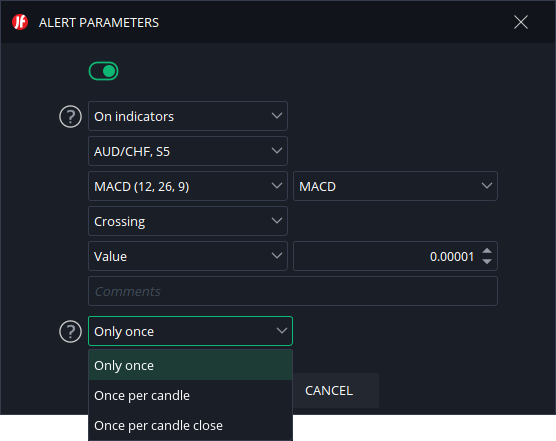
Alert trigger limit
Users can set the trigger logic for alerts on indicators:
- Only once
- Once per candle
- Once per candle close
Cumulative Volume Delta
We have added new built-in indicator: Cumulative Volume Delta or CVD
Candles without gaps
We have added new built-in indicator: No Gaps Candles or NO_GAPS_CANDLES
Version 4.2.8
Available since 08.Sep 2023
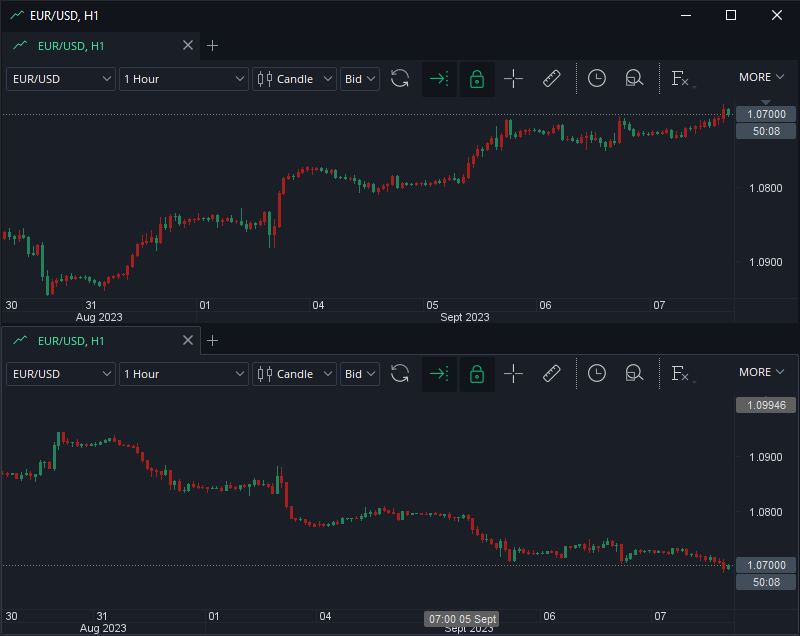
Invert scale
The price scale can be inverted now. Use Alt+I hot key or right click the price scale to open the menu.
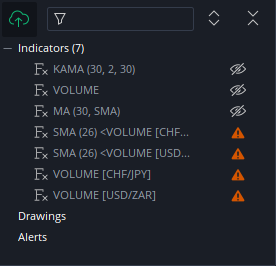
Warnings in Object manager
If the indicator cannot be displayed, because of the dependency on another indicator or the instrument, which is not added to the chart, a warning is shown in Object manager. It shows the reason on mouse hover.
Version 4.2.7
Available since 24.Aug 2023
Drawings in sub-panels
The drawings in the sub-panels are saved in JCloud properly now. They get linked to the instrument and stick to the indicator they get drawn onto.
If there are several indicators added in one sub-panel, the drawings stick to the one which is on top. If you need to add an object to the indicator underneath, hide the indicator on top.
Zoom in/out
Chart can be zoomed in/out if the drawing object is selected.
Locked position of Instant order widget
Instant order widget can be locked to any corner of the chart. Right click the widget and select one of the 4 positions in the menu.
Synced list of the instruments
The lists of the subscribed instruments are synced among the app on iOS and the Desktop version now. App on Android will join soon. This is the first step towards the setting synchronization among the platforms.
Arranging the objects
The order of the drawings and indicators can be changed in Object manager using Drag&Drop. The same order can be managed from the context menu.
Place in selected folder
If a folder is selected in Object manager, any added drawing will be placed inside it unless Place new here option is enabled for any other folder.
Find in chart
If a drawing is selected in the Object manager. a new function Find in chart can be used to find that object in the chart. Double click will also work.
When the object is selected in the chart, right click and use Find in Object manager to find it in the manager. This is useful if there are many objects added and the list needs to be scrolled to find that object.
Cloning on MAC
The drawing can be cloned with Cmnd+Mouse drag in MAC now.
Version 4.2.5
Available since 04.Jul 2023
Copy folder structure
The folder structure in Objects manager can be copied and pasted in other charts. Right click the Indicators or Drawings nodes and select "Copy folder structure".
Collapse/Expand folders
There are 2 new buttons added in the toolbar of the Objects manager.
- Collapse
- Expand
Use them to fold/unfold the folders in all 3 nodes (Indicators, Drawings, Alerts). They work for 2 levels.
Version 4.2.4
Available since 28.Jun 2023Auto-shift all charts
All the charts can be scrolled to the current candle (auto-shift enabled) with a new hot-key combination: Ctrl+End
Dock in main window
Undocked window can be returned to the main window from the context menu.
Version 4.2.3
Available since 16.Jun 2023Show/hide objects
Multi-selected objects can be shown/hidden in Objects manager.
Major release 4.2.1
Available since 07.Jun 2023Chart objects
We have simplified the objects saving in charts.
Instead of displaying the objects saved locally and in JCloud simultaneously, user can switch from JCloud mode to Local mode with this button:

Users, who are used to the trading platform of the previous generation, where all the objects are saved in each chart separately, can choose Local mode in each chart.
Users, who are eager to use the new features and the full potential of the JCloud synchronization, need to enable the JCloud mode.
Read more about this in the Charts section of the platform manual.
Economic events
We have redesigned the economic events calendar.
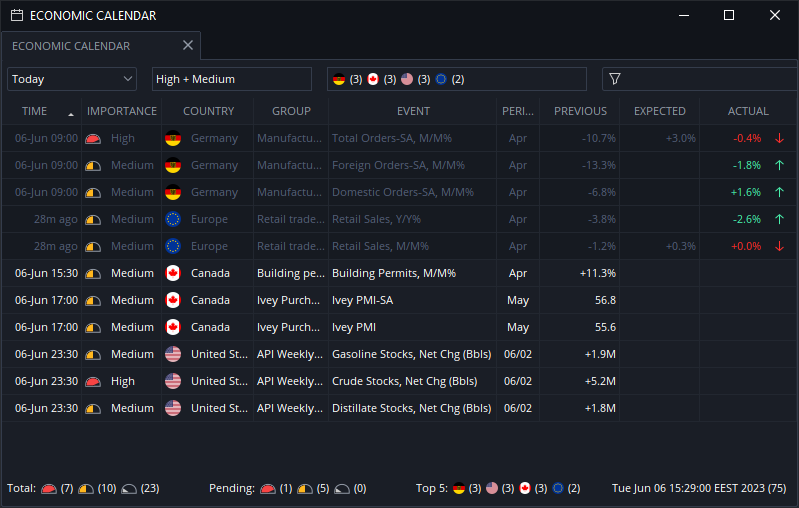
Notification pop-ups are shown, when the events are released as well.
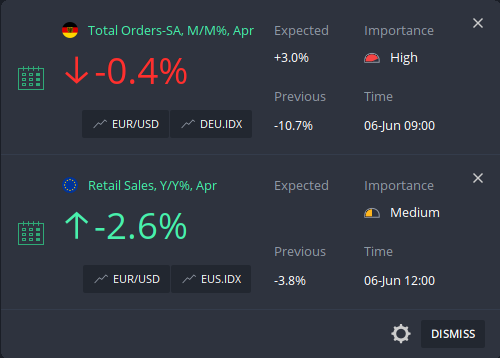
Read more about this in the Economic events section of the platform manual.
Hotkeys
Hotkeys are shown in the tooltips of the buttons now.
Day start time
Day start time zones list has been updated
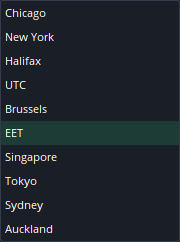
Read more about this in the Preferences section of the platform manual.
Strategy tester
Strategy tester's (former Historical tester's) performance has been improved due to the historical price data files download speed increase mostly. The files are downloaded in archives, if possible.
Paths saving
Paths to different folders are saved for each computer separately now. This is important if one and the same workspace .jfw file is used on many computers (uploaded in JCloud).
Commission fees
Commission fees paid for position opening are shown in COMMISSIONS column in POSITIONS table. Right click the panel to enable this column.
Comments
Comments shown in ORDERS and POSITIONS tables have been improved on server and platform side. They should not disappear anymore.
Version 4.1.7
Available since 02.Mar 2023Hotfix of few bugs.
Version 4.1.6
Available since 27.Feb 2023Show/hide layer
Chart layers of Indicators, Drawings and Alerts can be be shown/hidden in Object manager.
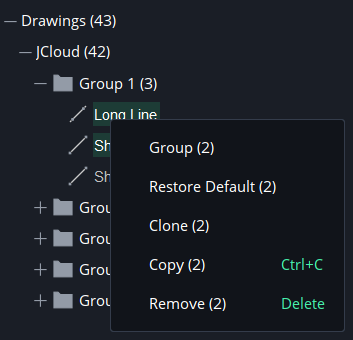
Ungroup drawings
Drawings can be moved outside the group.
Version 4.1.4
Available since 17.Feb 2023Objects synchronization
If the charts are linked in one group, visibility state switch (show/hide) will be synchronized.
Grouping of objects
Drawings can be grouped in chart now. Grouping is a creation of a new folder, where the objects are moved.
Version 4.1.3
Available since 01.Feb 2023Alerts on equity
It is possible to place alert on Equity level now, which is monitored by Notification server.
Folders for Drawings
Folders can be created for drawings in Object's manager.
Folders are saved only if at least 1 object is placed within it.New column P/L %
There is a new column added in Positions table. It is hidden by default. Right click to add it.
More linkage groups
4 more groups have been added.
They can be used to link many panels across the platform:
- Instruments
- Hotlists
- Charts
- Positions
- Positions summary
- Orders
- Alerts
Short line angle
Short line can be drawn at 0, +/- 45, +/- 90, +/- 135 or 180 degrees angle if Shift is pressed.
Note that the angle will be kept no matter how the price scale changes. This can be disabled in Edit coordinates dialog.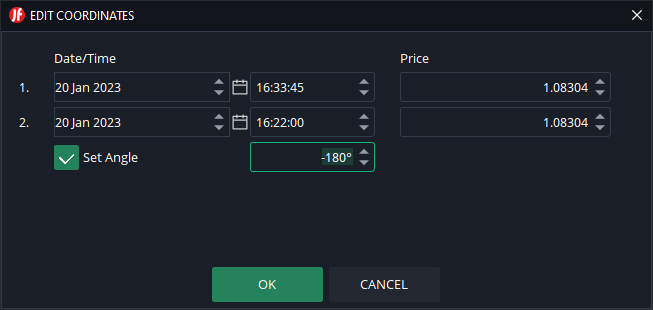
Version 4.1.2
Available since 30.Dec 2022Chart objects migration
It has become possible to import the chart objects from the old generation of the platform into the new one. All you need to do is save the chart template in the old version and open it in the new. The opening can be done from the chart toolbar (Open template) or simply by Drag&Drop method onto the chart.
The chart objects - indicators, drawings, retracement tools and patterns - will be imported as local objects. Please open OBJECT MANAGER in the chart and manage them properly. In case they need to be moved to JCloud, this can be done by drag&dropping them to JCloud node.
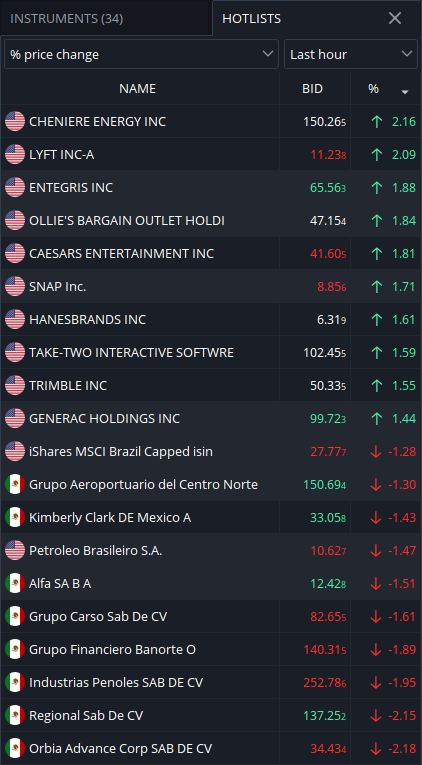
Remember that indicators saved in JCloud are shown in all charts, no matter what instrument is chosen. Drawings stored in JCloud are linked to the instrument.Hotlists
Hotlists can be added in the main menu, View section.
There are 2 hotlists:
- % price change
- % high/low range
The first one displays 10 CFDs on Stocks with the largest price increase and 10 with the largest price decrease. The second one shows the top 20 companies with the largest Low to High price range.
If any instrument in Hotlist is selected, full subscription is made.
Cut right side
The right side of some objects can be cut with a newly added tool. This feature can be found in the context menu. Hotkey can be assigned as well.
Currently this feature is added to:
- Rectangle
- Percent lines
- Fibonacci Retracements
- Fibonacci Expansion
Hotkeys for extend
Hotkey can be added for Extend feature now.
The following objects can be extended currently:
- Rectangle
- Percent lines
- Fibonacci Retracements
- Fibonacci Expansion
Period separators
Period separators show both - time and base period - change in price based charts now.
Copy/Paste
Chart objects can be copied and pasted into other charts now.
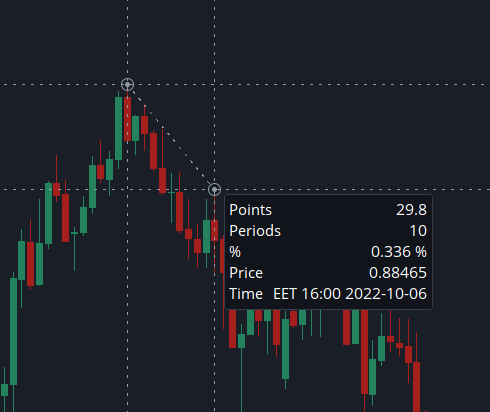
Measure tool
Measure tool in chart has been improved slightly. If the measuring has been started it can be canceled with Esc key or right mouse button click.
Major release 4.1.1
Available since 8.Dec 2022Sync charts by time
All the charts of the same group can be scrolled to the same point of time on double click now. If cursor pointer is enabled, it can be clicked anywhere on chart. If not, click the candlestick, bar or line. A vertical line will appear for a fraction of a second in all charts to display the exact time of synchronization.
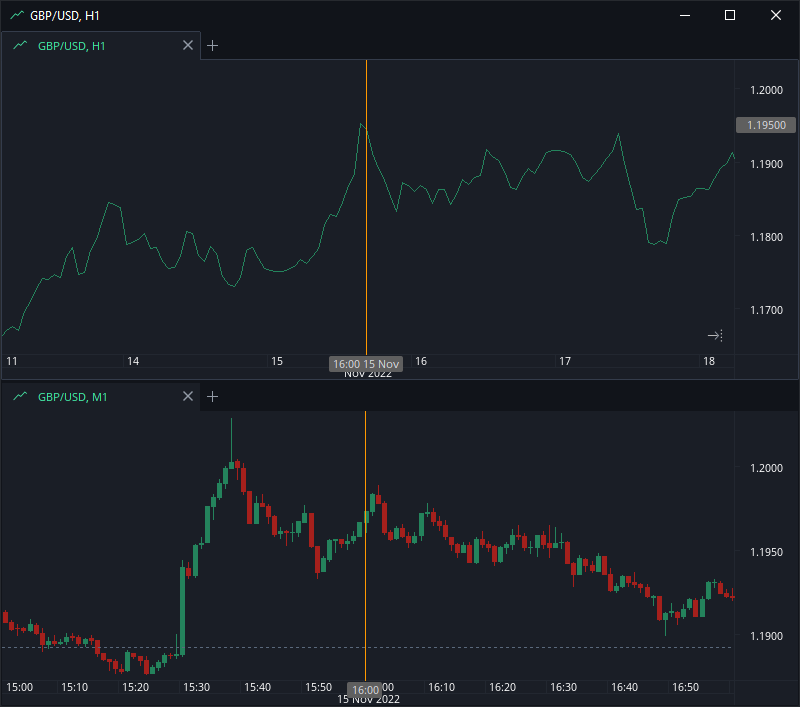
Scroll charts by time
All the charts of the same group can be scrolled by time or by time range now.
- By time - the charts are synced by the rightmost candlestick
- By time range - the charts are synced by the rightmost candlestick and the zoom level is adjusted if possible to display the same time range
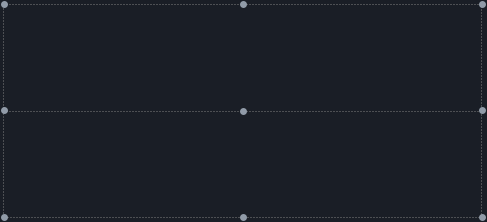
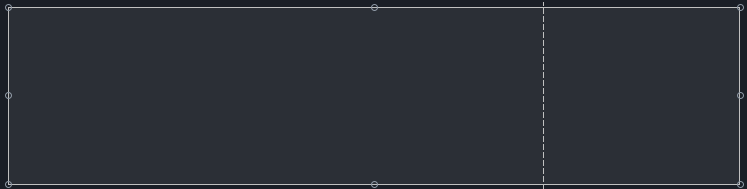
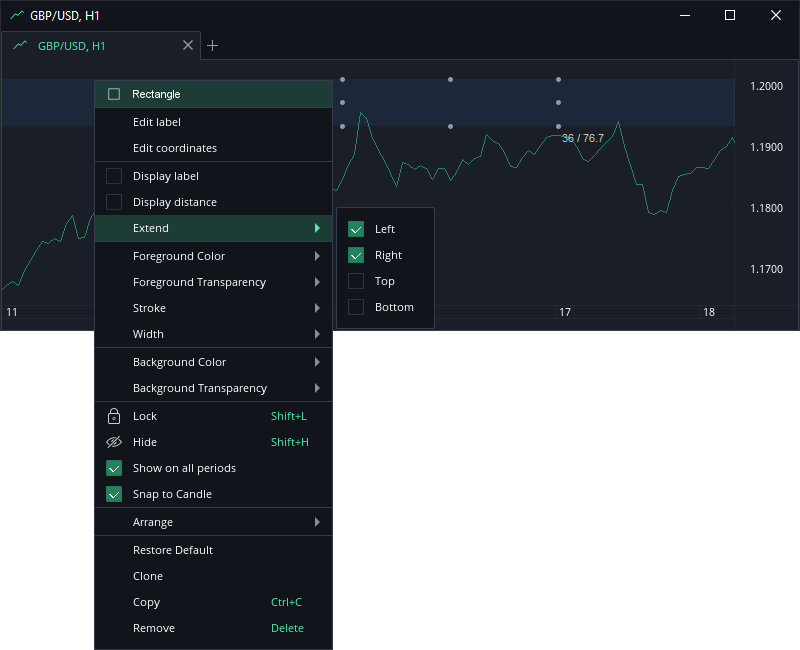
Extend Rectangle
Rectangle can be extended to all 4 sides now.
Version 4.0.32
Available since 23.Nov 2022New button: Measure
A new button Measure has been added in chart toolbar.

This same tool was a part of Cursor pointer tool. It has been made separate in order to be able to move the chart with left mouse button hold when Cursor pointer is enabled.
Use Shift + Left mouse click combination to use this tool. This hotkey can be changed in Preferences.
Improved cursor pointer
The cursor pointer has been improved in chart.
- chart can be scrolled with mouse even if the pointer is enabled now
- if Cursor pointer is enabled in one chart, it gets enabled in all the charts of the same group automatically
- Cursor pointer can be enabled in all the charts of the same window (no matter if grouped or not) with a new hotkey: Ctrl + Shift + X
Editing the labels
The editing dialog of the chart object (drawings, retracement tools, patterns) has been improved. It can be opened on double left mouse button click on the object.
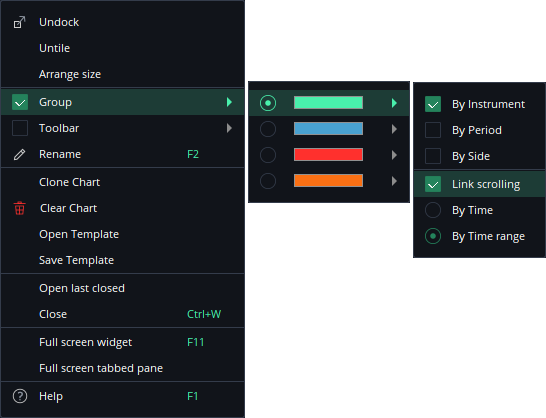
Assign group for tables
It is possible to assign a group for the Instruments, Positions, Positions summary and Orders tables now. Same group, which can also be assigned to charts.
Note that only the groups, which have the linkage by instrument enabled, can be assigned.As a result, if any row is selected in these tables, the charts of the same group will switch to that same instrument automatically.
Restructured View menu
View section of the main menu has been restructured. It shows all the possible panels now, grouped according to the place they dock: left, top, bottom or undocked.
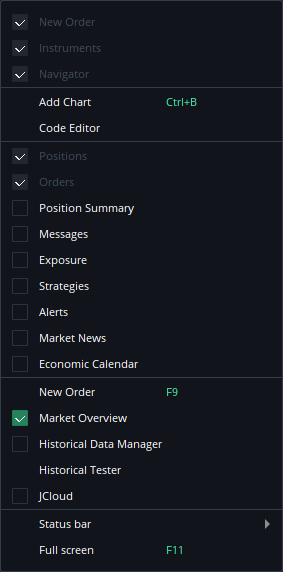
Position Summary and Messages panels can be hidden now.
Version 4.0.31
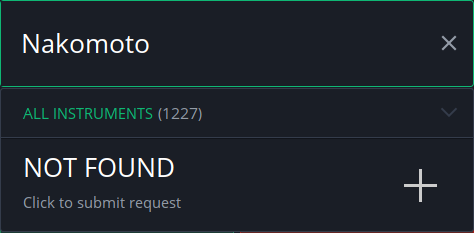
Available since 27.Oct 2022Instrument add request
In case you cannot find an instrument you were looking for, you can submit a request to add it.
Blue / Red theme
Another version of the platform color themes has been added. It is the opposite of Asian style theme Red / Blue, where the price up movement is shown in red and down movement in blue.
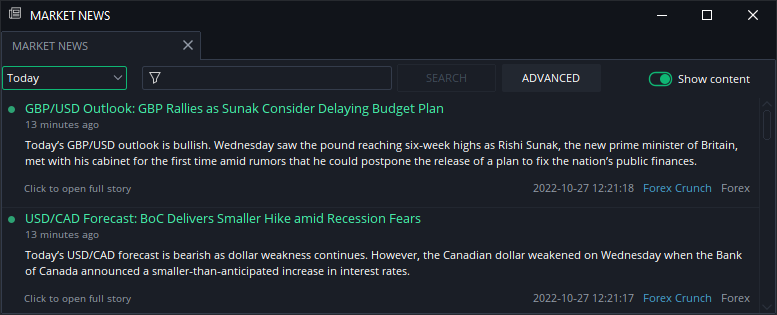
Market news
Market news panel has been redesigned. The content of each story is shown now by default. Click to view full story in web browser. Disable Show content to return to the old design.
Amount precision
Amount precision has been improved in this version. Amounts up to 6 digits after comma are shown now, when needed. For example: 0.654321 BTC/USD
Hotkey for Alert creation
A hotkey can be assigned for alert creation dialog.
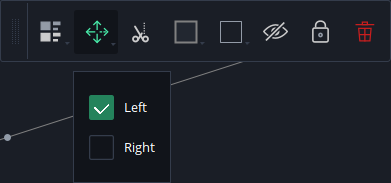
Fix order's labels
Order's labels can be fixed to the left side of the chart now. Look for a new settings in Preferences/Chart settings.
Editing label of Rectangle
The editing dialog of the label of Rectangle has been improved. This will be done for other chart drawing objects in next versions as well.
Editing the indicator on double click
Most of the indicators can be edited by opening the settings with double click on the indicator's output.
New indicator: GATOR2
New indicator has been added: GATOR2. It is the improved version of GATOR, which output and shift can be adjusted properly now.
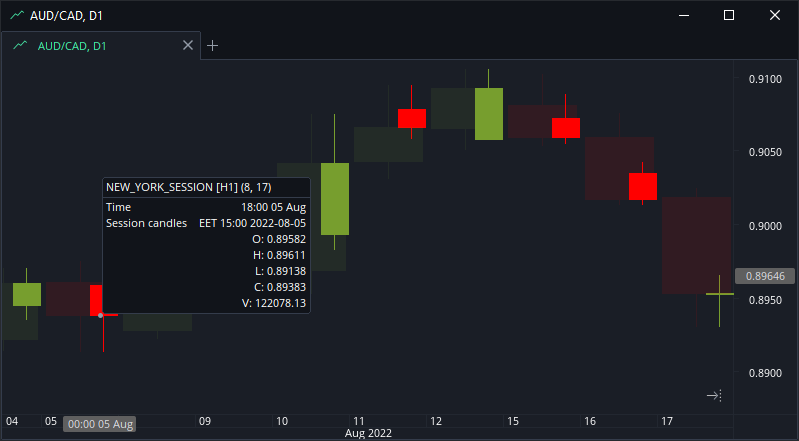
New trading session indicators
There are 4 new indicators added:
- NEW_YORK_SESSION
- LONDON_SESSION
- TOKYO_SESSION
- SYDNEY_SESSION
They show price history limited by each trading session. Below is shown a picture of the combination of CUSTOMCANDLES and NEW_YORK_SESSION on a daily time frame.
New York session hours can be adjusted in the input settings (8:00 - 17:00 New York by default).
Shift of indicators
The min/max limit of the indicator's output shifts has been increased from -300/300 to -5'000/5'000
Version 4.0.29
Available since 30.Aug 2022Alerts
A dedicated button to remove the inactive Alerts has become available in Alerts panel.
The settings of the Alerts have been moved to the Preferences. E-mail can be sent to the registered address only now.
Version 4.0.28
Available since 6.Jul 2022Alerts
It has become possible to edit the alerts from the chart. Multi selection works as well using Ctrl or Shift + mouse.
Version 4.0.27
Available since 16.Jun 2022Alerts
We have added context menu, increased the maximum limit of the price alerts, rectified the issue with the crossing condition and different other minor problems.
P/L in decimals
Estimated Profit/Loss in chart is shown with decimals if the value is greater than -100 and less than 100. Estimated P/L is calculated correctly for open positions in the Calculator as well now.
Version 4.0.25
Available since 19.May 2022New indicator: Volume Oscillator
New indicator has been added: VOLUME_OSCILLATOR
Font size in code editor
The font size can be adjusted in Code Editor. Use mouse wheel + Ctrl.
New Hot keys
Use Ctrl+` to switch between the tab panes of charts. Ctrl+Tab to switch the tabs.
It is possible to add hot keys for the chart types in this version. The below are set by default:
- Area (Ctrl+1)
- Line (Ctrl+2)
- Bar (Ctrl+3)
- Candle (Ctrl+4)
- Table (Ctrl+5)
The bug with the hot keys for the chart periods has been resolved.
Chart objects linked
Local chart objects are linked to the instrument they were added to in this version. They remain shown in OBJECT MANAGER with the linked instrument in square brackets []
Reconnection issues
Reconnection logic has been improved in this version.
- There should be no missing price history after sleep/wake up anymore.
- The speed of reconnection on MAC has been improved
Issues on MAC
We have addressed several issues on MAC:
- Vertical and horizontal scroll in chart (magic mouse or track pad)
- Dropdown list closing in case of scroll (mainly an issue on magic mouse)
- Price and amount spinner issues. Values can be changed with vertical or horizontal scroll now.
- The speed of disconnect detection after wake up
Order preview lines
When Order entry dialog is called from chart (context menu or F9 hot key), the order preview lines are shown across all the charts now. They are not shown in all the charts if there is an inner chart enabled in this dialog.
Workspace
Several issues with workspace saving have been rectified.
New checkbox has been added in Workspace menu: Save in JCloud
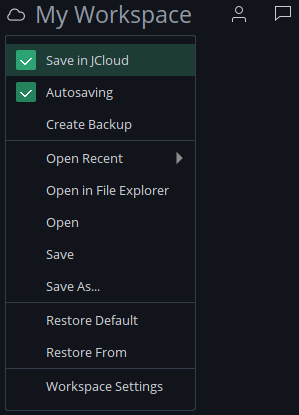
If checked, the workspace gets saved in JCloud. If uncheked - in local folder.
Alerts
Alerts can be set on negative values of indicators, for example, Oscillators.
Version 4.0.24
Available since 27.Apr 2022Margin calculation
Margin calculation was incorrect in the Amount spinner's tooltip. The issue has been fixed.
Workspace
The issues with loosing the Workspace saved in JCloud have been rectified.
Chart templates
Chart built-in templates are loading properly now and the list gets saved in Workspace.
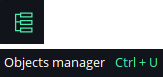
Hot keys
How key for OBJECT MANAGER has been assigned. Use Ctrl+U by default.
The instrument can be changed in chart with the up/down arrows, if the focus is set on the proper combo box. Same with the chart type, period and side.
Issues on MAC
The output color issues for the indicators have been resolved.
Quick period search
Use F6 hot key to quickly search and change the time period on chart.
Notification service
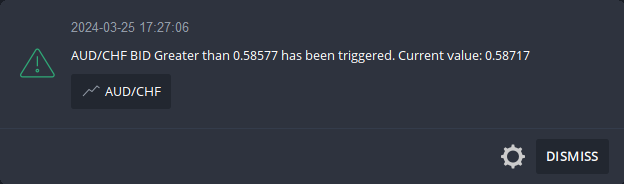
Price alerts
The price alerts are placed on Notifications server now and synced across all our platforms.
Alerts on indicators
Alerts on indicators can be placed now. These are linked to each specific chart and triggered by the platform.
Alerts management
The alerts on price as well as on indicators can be managed from the ALERTS panel or OBJECT MANAGER inside the chart.
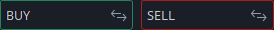
Trading
Side switch
The side can be switched with one click instead of the two.
Preview
Enable PREVIEW to preview the order line(s) in charts.

Price format
The price of the STOP LOSS and TAKE PROFIT can be displayed in:
- points (a dot is displayed in the spinner)
- price
- % from price (% is displayed in the spinner)
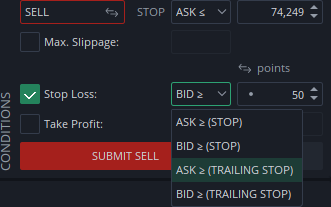
Opposite trigger
STOP and STOP LOSS orders can be placed with the opposite trigger side to avoid triggering them on wide spreads, when liquidity is low.
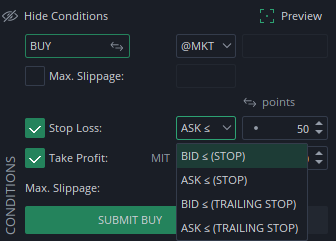
There is a special setting in PREFERENCES under TRADING SETTINGS, which sets the opposite trigger side automatically. It is disabled by default.Trailing Stop
TRAILING STOP LOSS orders can be placed by selecting one of the 2 options in the drop down list:
Take Profit as MIT
In order to increase the chance of filling the TAKE PROFIT order, it can be set as MARKET IF TOUCHED (MIT) type of order. This order will be processed as a market order when the price of the TAKE PROFIT order is triggered. It is mandatory to set the MAX SLIPPAGE, which limits the order's price of execution. In case it is not possible to fill the order within the price range set, it will remain working at the new limit price.
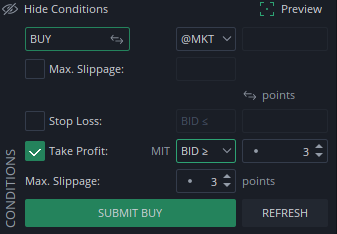
There is a special setting in PREFERENCES under TRADING SETTINGS, which sets the Take Profit as MIT automatically. It is disabled by default.Orders on market breaks
It is possible to manage the pending orders on market breaks, including the weekend.
Market On Open
Market orders can also be sent on trading breaks. They will be accepted as MARKET ON OPEN (MOO) orders and executed right after the first price update, when the market opens.
Such orders have MOO type shown in ORDERS table and can be edited or canceled at any time.
The following MOO orders can be placed:
- Entry MOO
- Closing MOO
- Reverse MOO
- Double MOO
Only one MOO order will be accepted by the server for each open position. Closing MOO cannot be placed if STOP LOSS or TAKE PROFIT for that position exists. It is not possible to set STOP LOSS or TAKE PROFIT for Entry and Reverse MOO orders to avoid the position open and closing right after (loosing the bid/ask spread).
Reverse position
In order to quickly REVERSE the direction of the opened position, we have added a special button in POSITIONS table.
If clicked, a market order twice the amount of the existing position, but opposite direction, is sent and, if filled, both positions are merged into one.
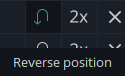
Attention! If ONE CLICK mode is enabled, this button will reverse the position in one click!
If not, the confirmation dialog will be shown.
Please read the manual of the PREFERENCES to find out how to set STOP LOSS and TAKE PROFIT for reversed positions automatically. MAX.SLIPPAGE can also be applied for REVERSE order.Double position
In order to quickly DOUBLE the position open, we have added a special button in POSITIONS table.
If clicked, an order of the same amount and same direction is sent. If filled - both positions are merged.
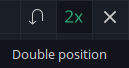
Attention! If ONE CLICK mode is enabled, this button will double the position in one click!
If not, the confirmation dialog will be shown.
Please read the manual of the PREFERENCES to find out how to set MAX.SLIPPAGE for DOUBLE position order automatically.Offline messages
The trading events of the account, which happened while the platform was offline, are shown on the platform launch now.
They appear as pop-ups (if enabled) and in the MESSAGES panel.
Charts
JCloud objects
Probably the most important feature of the 4th generation platform is a possibility to store the chart objects in our cloud service JCloud.
The following objects can be uploaded to JCLOUD:
- drawings
- retracement tools
- patterns
All of the above mentioned objects are linked to an instrument they were drawn onto, if uploaded in JCLOUD. As a result, if the objects are managed (added, removed, edited) in one chart, the changes are applied to all the other charts of the same instrument instantly. Even in another instance of the platform.
Besides the drawing objects, a list of the used INDICATORS is also saved in JCLOUD. This list is not linked to any instruments traded. The settings and the last visibility state is saved there as well. Therefore, if a new chart is added in the platform, it shows all the indicators saved in JCLOUD.
If there is no need to synchronize the objects across all the charts, the objects can be saved in each chart separately. These objects need to be moved from the JCLOUD node to CHART node in OBJECT MANAGER using Drag&Drop.
The newly added objects are saved in JCLOUD if this button is enabled:

This button is available in the chart toolbar as well as in the OBJECT MANAGER.
Object manager
All the chart objects are displayed in OBJECT MANAGER, which can be enabled in the chart toolbar.

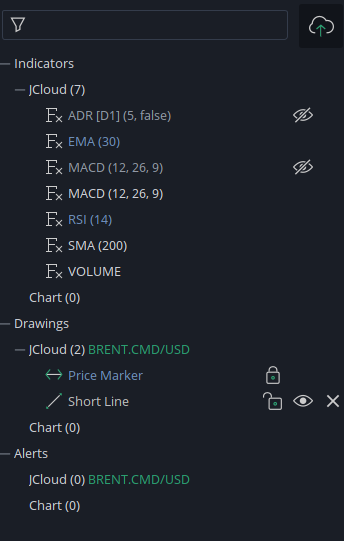
It shows:
- Indicators
- Drawings
- Retracement tools
- Patterns
- Alerts
More information can be found in Charts manual.Favorites
Enable this icon:

to show the FAVORITES widget on the chart.
The following objects can be added into FAVORITES widget:
- Periods
- Drawings
- Retracements
- Patterns
Mark them with the star in the menu:
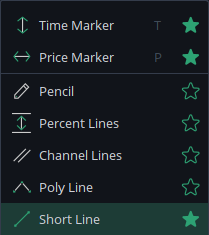
The widget can be displayed horizontally or vertically. Right click on the widget to change the layout.
Economic events
It is possible to see the ECONOMIC EVENTS on the chart.

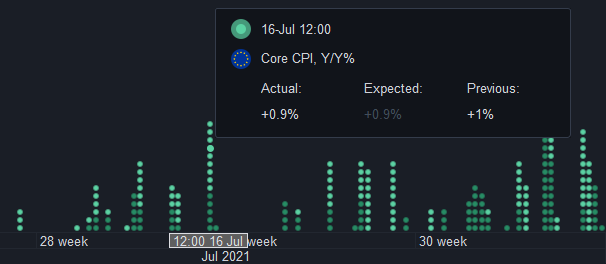
There are 3 importance levels:
- High
- Medium
- Low
Only the first 2 are enabled by default. Right click the events to enable the LOW importance as well.
Replay mode
Users, who would like to test their technical analysis and chart reading skills, can repeat the price history on each chart now. Besides, they can paper trade inside that mode and check the results.
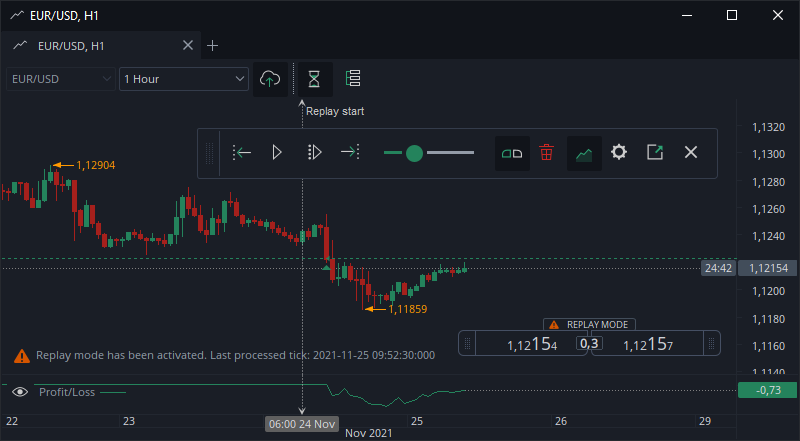
Replay mode works on each chart separately. Enable the mode by pressing on this toggle button in chart toolbar:

More information can be found in Charts manual.Orders labels
Orders labels are improved.
- If cursor is on the line, they appear where the mouse cursor is.
- The cross button for position close or order cancel has been moved to the left side to avoid its position dependency from the label total length.
- The comment is displayed on chart now.
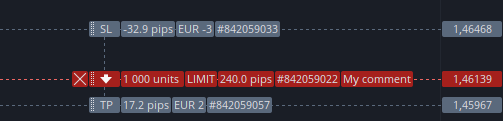
Table view
The indicator values can be shown in the table view mode. Use this button to select the columns in the table:
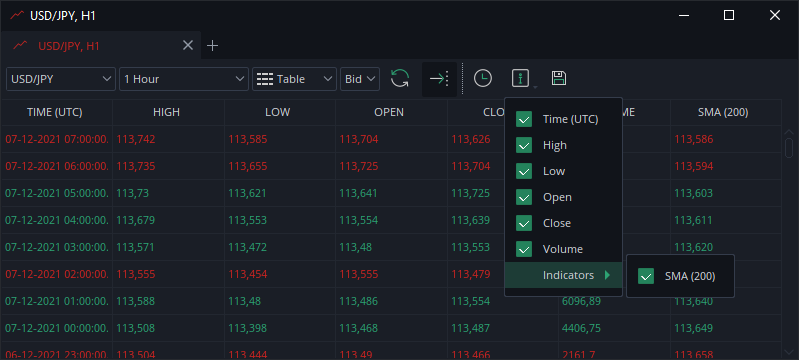
The data can be copied to the clipboard in a simple way:
- Ctrl+A to select all rows
- Ctrl+C to copy them
Countdown to candle close
The countdown to candle close can be shown next to the current market price.
It can be enabled or disabled in the CHART LAYERS menu.

Layers
The menu with the chart layers settings can be opened with right click on price or time scales.
Tradable instruments
Toggle this button in order to see the instruments, which are not on market break or temporary unavailable.
Strategy tester
Order processing
We have improved the order processing approach.
We used to execute the orders at the interpolated prices if any of the interpolation methods were chosen. That lead to pretty huge difference between the order and the execution prices. To solve this, we execute the orders at the price of the order now, except the cases when there is a market gap (market opens with a gap after the break). In these cases the LIMIT orders are filled better, but STOP orders without MAX.SLIPPAGE setting are filled at the first price. If the STOP orders have the MAX.SLIPPAGE setting, and the execution price is outside the limit, the orders are resubmitted as LIMIT type orders.
The logic is described below:
- the orders, which have BID side of trigger are compared to interpolated prices of the BID candles. ASK side to the ASK candles.
- if the oder (It does not matter what type the order is) is triggered by CLOSE, HIGH or LOW price tick, we fill it at the ORDER PRICE adjusted by last known spread if necessary (in case of opposite side trigger).
- if the order is triggered by OPEN price tick, we fill it by the OPEN price tick corresponding to the necessary side. The exclusion is a STOP order with a MAX.SLIPPAGE set. If the OPEN price tick is outside the STOP LIMIT, the order is changed to a LIMIT order.
Manuals
Platform manual is available in main menu: Help/Platform manual
It can be open by pressing F1 hot key. If the focus is set on any specific panel, that section of the manual will open.