Backtesting Strategies
This article explains how to backtest strategies in Desktop JForex3.
Backtesting of strategies in JForex is done using the Historical Tester , which aims to replicate market conditions with historical data and runs the strategy as a simulation within the sample history. The data sample is built from marketplace data (tick after tick), therefore allowing the implementation of powerful and efficient back testing methods.
Past performance is no reliable indicator of future performance.Historical Tester
To open the Historical Tester and start the simulation:
- Go to View in the menu bar at the top of the platform and select Historical Tester.
- The Historical Tester is now displayed as a new tab (next to other tabs such as Orders, Positions, Messages).
- Select your strategy from the drop down menu (if it has already been added to the workspace, otherwise add it).
- Adjust the tester settings as required (more on the different options below).
- Click on the start button (
 ).
). - The Define Parameters window appears. This is where you set the variable values (as defined in the strategy code, e.g. instrument, slippage, amount etc.) that are used for the simulation.
- Click on Run to start the simulation.
- After the simulation has finished (this may take a while), the testing report is opened in your browser.
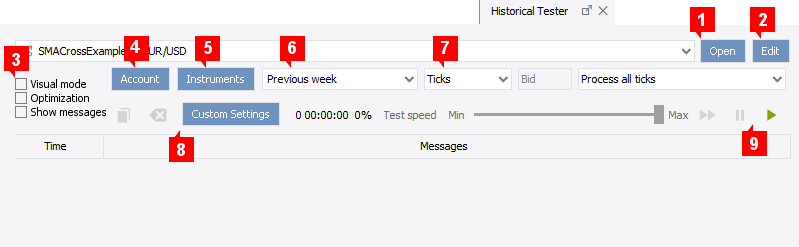
- Open (1) - opens the file dialog window which allows you to add new strategies.
- Edit (2) - opens the strategy in the strategy editor (available only when source file .java is available).
- Visual Mode (3) - if enabled, the simulation is drawn on the chart while it is being tested.
- Optimization (3) - allows to run multiple tests if the strategy uses variable parameters.
- Show messages (3) - shows messages if enabled.
- Account (4) - allows to define tester account settings (equity, account currency, etc).
- Instruments (5) - historical data is loaded for selected instruments only (the testing instrument(s) are selected at a later stage).
- Sample Period (6) - selection of sample period.
- Time Frame (7) - selection of the time frame for the sample period.
- Ticks and candles (1 Minute, 1 Hour or 1 Day) available
- Bid/Ask (if candle period selected)
- Tick Filters and Interpolation Methods (for candles).
- Custom Settings (8) - additional custom settings.
- Start Button (9) - a click on the start button initiates the testing process and opens the Define Parameters dialog. If the strategy is tested in Visual Mode, additional playback functions are available to pause and decrease the testing speed.
Optimization
If the strategy uses parameters, you can set up a multiple testing environment (e.g. different instruments, periods and order settings).
For each parameter (except instrument and period), the minimal value, steps and the maximum value can be defined. The strategy is then tested separately for each step of the parameter.
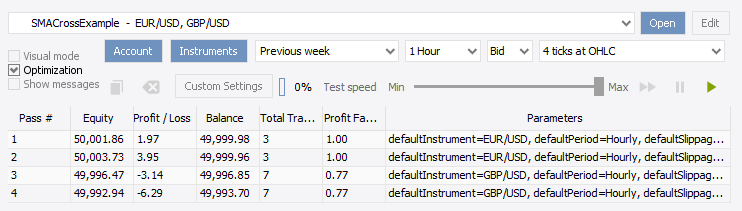
After pressing the start button, the Define Parameters window appears where you can define the steps and the maximal value for the strategy parameters. It is also possible to select multiple instruments and periods.
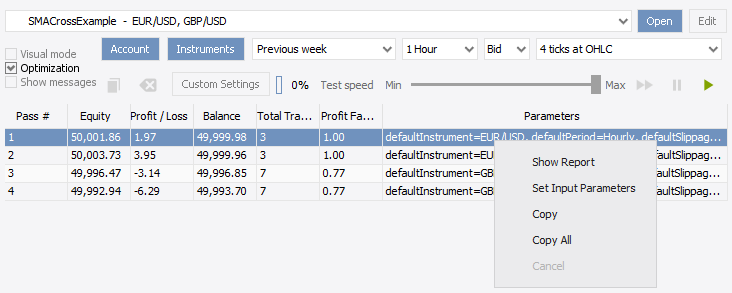
The result of the different combinations are listed in the lower part of the Historical Tester window. Right-click on any of the combinations to cancel, copy, show the report or to set the input parameters.
What is the Profit Factor?
The Profit Factor is the ratio between the sum of all profit trades (Gross Profit) and the sum of all loss trades (Gross Loss).
If Gross Profit = 1000 and Gross Loss = -250, the Profit Factor = (1000/250) = 4
The Profit Factor is always a positive value.
-
Case 1:
Initial balance = 50,000
Gross Profit = 1000
Gross Loss = -500
Balance: 50,500Profit Factor = 2.0
-
Case 2:
Initial balance = 50,000
Gross Profit = 100
Gross Loss = -25
Balance: 50,075Profit Factor = 4.0
Account
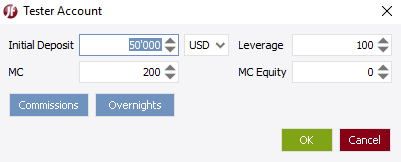
In the Tester Account dialog, you can set the initial deposit, account currency, leverage and define the margin cut level (in % as use of leverage) and the equity stop loss (MC Equity).
Instruments
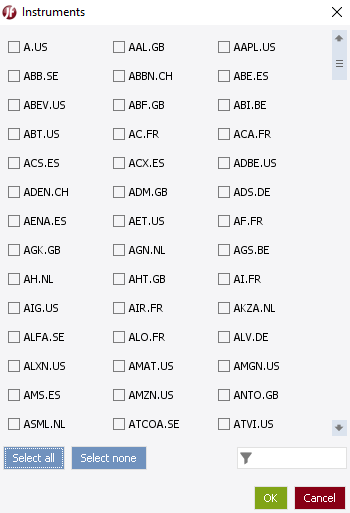
For all selected instruments, historical data is downloaded and made available to the strategy. Any instrument that the strategy uses for trading and/or calculations, needs to be selected.
If Visual Mode is enabled, charts are opened for all selected instruments.
NOTE: The instrument(s) which are tested in the simulation are not selected here. They are either hard coded in the strategy code or selected in the Define Parameter window.
Tick Filters
These tick filters are available if the time frame is set to Ticks.
- Process all ticks - most precise testing method for any testing, yet also the slowest one. This method retrieves all tick data that was ever shown at the platform and could be traded as well.
- Process all ticks with a different non recurrent price - applies tick skipping policy depending on price change.
-
Process ticks on a market direction - applies tick skipping policy depending on price direction change (starting from the tick at the very turning point).
Example for how ticks are filtered on a market direction change:
- bid 1.34 ask 1.35 - not skipped
- bid 1.34 ask 1.36 - market goes up - the tick will be skipped
- bid 1.35 ask 1.37 - market goes up - the tick will be skipped
- bid 1.35 ask 1.36 - market has a tendency to go down - the tick is reversal, i.e not skipped
- bid 1.34 ask 1.37 - market has no clear tendency - the tick will be skipped
- bid 1.35 ask 1.36 - market has no clear tendency - the tick will be skipped
- Process ticks on a predefined price range change - applies tick skipping policy depending on predefined price range change.
- Process ticks with the specified time interval - applies tick skipping policy depending on predefined price range change.
Interpolation methods
The interpolation methods are available if the time frame is a candle period (1 Min, 1 Hour, 1 Day).
For the sample period, all ticks will be generated from the candles using the selected interpolation method. No tick data is downloaded which speeds up the testing process.
For example, if a strategy uses 1 Min candles for trade decisions and it does not need any smaller periods, select 1 Min as the time period and 4 ticks on OHLC as the interpolation method. In this case, the strategy will receive only 4 ticks every minute: one at open time with an open price, one with a high price and so on.
- Cubic Spline - is the most precise testing method for testing on candles. The method creates ticks using the Cubic Spline method. It uses OHLC prices as the base points. In some cases (10 Sec period, for example) it can create more ticks than there would be in a real system for the particular candle.
- 4 ticks at OHLC- generates 4 ticks for each candle only. The prices getting from OPEN HIGH CLOSE LOW prices.
- Tick on Open - creates one tick with an open price for every candle of the selected period.
- Tick on Close - creates a one tick with a close price for every candle of the selected period.
Custom Settings
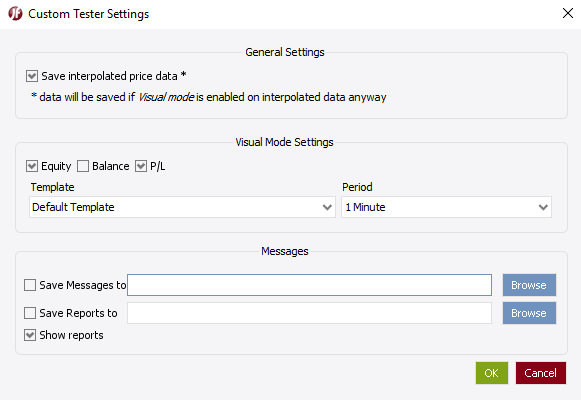
General Settings
- Save interpolated price data - enabled/disable saving of interpolated price data.
Visual Mode Settings
- Equity, Balance and P/L - can be shown/hidden in Visual Mode.
- Template - enables to select a previously saved chart template (taken from the default location for templates).
- Period - default period used for Visual Mode.
Messages
- Save Messages to - enables strategy messages in the Historical Tester console and saves them to a file.
- Save Reports to - enables saving the testing results to a report file.
- Show Reports - displays report with test results after the test has been finished.
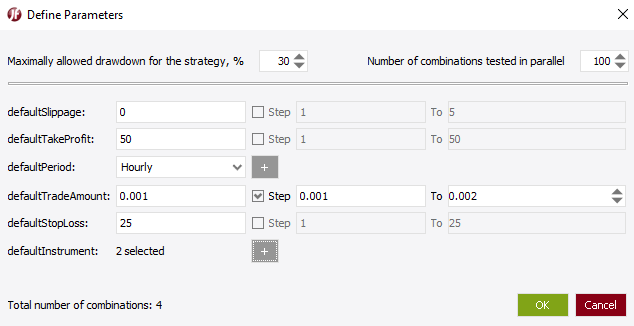
Define Parameters
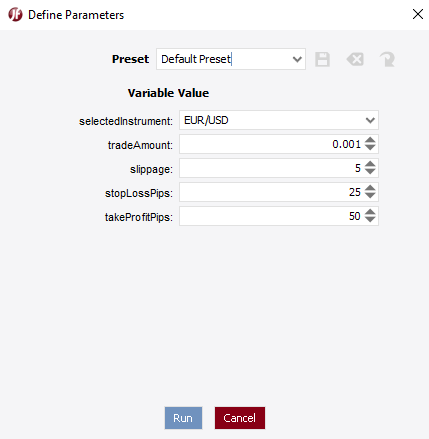
After clicking the start button, the Define Parameters window appears.
All values that are defined as variable parameters in the strategy, can be set here.
NOTE: The content of this window depends on your strategy. There may be different, more or less variables available in your strategy than in the example.
Click on Run to start the simulation.