ITesterClient functionality
ITesterClient interface extends IClient functionality. The interface is used exclusively for working with historical data. This article provides examples of major ITesterClient features. The examples are based upon the TesterMain.java example located in the JForex-SDK project. Thus, in order to test attachment-less snippets one should simply integrate them in the TesterMain.java example program.
Testing over a particular historical time interval
By default strategies get backtested against the interval of last day. The user can modify this interval in the following way:
final SimpleDateFormat dateFormat = new SimpleDateFormat("MM/dd/yyyy HH:mm:ss");
dateFormat.setTimeZone(TimeZone.getTimeZone("GMT"));

Date dateFrom = dateFormat.parse("05/25/2016 12:00:00");
Date dateTo = dateFormat.parse("05/26/2016 00:00:00");

client.setDataInterval(DataLoadingMethod.ALL_TICKS, dateFrom.getTime(), dateTo.getTime());
DataLoadingMethod argument stands for the collection of ticks that get passed to strategies.
Modifying account data
ITesterClient interface includes a collection of methods to modify account data for historical data, to resemble those used in [[Historical_Tester#Account|Historical Tester]] of JForex client. For instance, one would modify the default account parameter values in the following way:
client.setInitialDeposit(Instrument.EURUSD.getSecondaryJFCurrency(), 150000);
client.setLeverage(80);
client.setMarginCutLevel(150);
Report settings
If one wishes to overview the testing results in a report, then he should add the following logic to the onStop method of ISystemListener:
@Override
public void onStop(long processId) {
    LOGGER.info("Strategy stopped: " + processId);
    File reportFile = new File("C:\\temp\\report.html");
    try {
        client.createReport(processId, reportFile);
    } catch (Exception e) {
        LOGGER.error(e.getMessage(), e);
    }
    if (client.getStartedStrategies().size() == 0) {
        System.exit(0);
    }
}
There are two optional parts for reports, which can be enabled/disabled (the both are enabled by default):
- setProcessingStatsEnabled adds processing stats like total time spent on each of the [[Overview#IStrategy_interface|IStrategy]] callback methods, indicator calculations, tick/bar processing etc.
- setEventLogEnabled adds log for all order state changes.
Report file customizations
Since reports are written in HTML files, they are editable just like any other text files (assuming, one follows the HTML formatting rules). See an example of inserting a line in the result table in
Report for each strategy
Consider creating a report for each strategy just by including the processId in the report file name:
@Override
public void onStop(long processId) {
    LOGGER.info("Strategy stopped: " + processId);
    File reportFile = new File("C:\\temp\\report"+processId+".html");
    try {
        client.createReport(processId, reportFile);
    } catch (Exception e) {
        LOGGER.error(e.getMessage(), e);
    }
    if (client.getStartedStrategies().size() == 0) {
        System.exit(0);
    }
}
Strategy Progress Listener
LoadingProgressListener interface serves as a progress bar, which announces the user of current position in every 30 minutes in the dataLoaded method. The user can cancel the running strategy, by returning true from the stopJob callback method. Consider stopping strategy after it is past 18:00:
client.startStrategy(new BarPrinter(), new LoadingProgressListener() {

    @SuppressWarnings("serial")
    private SimpleDateFormat sdf = new SimpleDateFormat(" MM/dd/yyyy HH:mm:ss,") {{
        setTimeZone(TimeZone.getTimeZone("GMT"));
    }};
    private boolean past18 = false;

    @Override
    public void dataLoaded(long start, long end, long currentPosition, java.lang.String information)  {
        LOGGER.info(information + sdf.format(start) + sdf.format(end) + sdf.format(currentPosition ));
        sdf.getCalendar().setTimeInMillis(currentPosition);
        //check if we have loaded a chunk of data later than 18:00
        if (sdf.getCalendar().get(Calendar.HOUR_OF_DAY) >= 18){
            LOGGER.info(" > 18");
            past18 = true;
        }
    }

    @Override
    public void loadingFinished(boolean allDataLoaded, long start, long end, long currentPosition) {}

    //stop loading data if it is past 18:00
    @Override
    public boolean stopJob() {
        return past18;
    }

});
Backtesting in GUI mode
Standalone API provides interfaces for working with charts outside JForex, see an example of testing a strategy in GUI mode. This section is intended to describe features that may extend the functionality of the example, like changing chart periods, adding multiple charts, adding indicators etc.
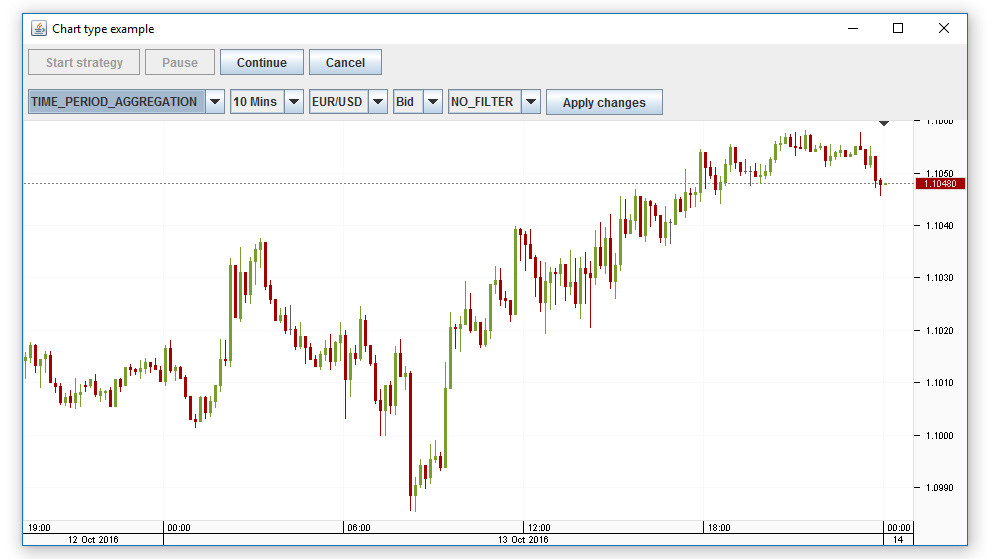
Change chart type
Chart feed data is defined by IFeedDescriptor and its type is determined by DataType, which can be:
- candle sticks (both standard and custom period),
- ticks,
- range bars,
- tick bars,
- point and figure columns,
- renko bars (bricks).
Consider adding a toolbar to the base example which determines feed data and allows the user to update the chart according to it:
Add Equity, Profit Loss and Balance
In order to add Equity, P/L and Balance to chart, one has to carry out 3 steps:
- Implement ITesterIndicatorsParameters by selecting which indicators to show.
- Implement ITesterVisualModeParameters where indicator settings get bound to particular instruments.
- Call ITesterClient.startStrategy with ITesterVisualModeParameters parameter.
Consider the following example:
 // Implementation of ITesterIndicatorsParameters
        final class IndicatorParameterBean implements ITesterIndicatorsParameters {
            @Override
            public boolean isEquityIndicatorEnabled() {
                return true;
            }
            @Override
            public boolean isProfitLossIndicatorEnabled() {
                return true;
            }
            @Override
            public boolean isBalanceIndicatorEnabled() {
                return true;
            }
        }
        // Implementation of ITesterVisualModeParameters
        final class TesterVisualModeParametersBean implements ITesterVisualModeParameters {
            @Override
            public Map<Instrument, ITesterIndicatorsParameters> getTesterIndicatorsParameters() {
                Map<Instrument, ITesterIndicatorsParameters> indicatorParameters = new HashMap<Instrument, ITesterIndicatorsParameters>();
                IndicatorParameterBean indicatorParameterBean = new IndicatorParameterBean();
                indicatorParameters.put(Instrument.EURUSD, indicatorParameterBean);
                return indicatorParameters;
            }
        }
        // Create TesterVisualModeParametersBean
        TesterVisualModeParametersBean visualModeParametersBean = new TesterVisualModeParametersBean();

        // Start strategy
        client.startStrategy(
            new MA_Play(),
            new LoadingProgressListener() {
                @Override
                public void dataLoaded(long startTime, long endTime, long currentTime, String information) {
                    LOGGER.info(information);
                }

                @Override
                public void loadingFinished(boolean allDataLoaded, long startTime, long endTime, long currentTime) {
                }

                @Override
                public boolean stopJob() {
                    return false;
                }
            },
            visualModeParametersBean,
            this,
            this
); Adding multiple charts
One may add a chart for each subscribed instrument. It is also possible to select different periods for each of the charts. Charts get added in the setChartPanels method. Consider that we have subscribed to EURUSD and GBPUSD instruments. In the following example and that we show tick chart for EURUSD and 10 min candle chart for GBPUSD:
public void setChartPanels(Map<IChart, ITesterGui> chartPanels) {
    if (chartPanels != null && chartPanels.size() > 0) {
        for (IChart chart : chartPanels.keySet()) {
            LOGGER.debug("Chart for instrument" + chart.getInstrument().toString());

            Instrument instrument = chart.getInstrument();
            setTitle(instrument.toString() + " "+ chart.getSelectedOfferSide() + " "+ chart.getSelectedPeriod());

            // show ticks for EURUSD and 10 min bars for other instruments
            if (chart.getInstrument().equals(Instrument.EURUSD)) {
                IFeedDescriptor feedDescriptor = new FeedDescriptor();
                feedDescriptor.setDataType(DataType.TICKS);
                feedDescriptor.setInstrument(Instrument.EURUSD);
                chartPanels.get(chart).getTesterChartController().setFeedDescriptor(feedDescriptor);
            } else {
                IFeedDescriptor feedDescriptor = new FeedDescriptor();
                feedDescriptor.setDataType(DataType.TIME_PERIOD_AGGREGATION);
                feedDescriptor.setOfferSide(OfferSide.BID);
                feedDescriptor.setInstrument(Instrument.EURUSD);
                feedDescriptor.setPeriod(Period.TEN_MINS);
                chartPanels.get(chart).getTesterChartController().setFeedDescriptor(feedDescriptor);
            }

            JPanel chartPanel = chartPanels.get(chart).getChartPanel();
            addChartPanel(chartPanel);
        }
    }
}
Note: When modifying the base GUI example, please also remove removecurrentChartPanel call from the addChartPanel method. GUIModeMultiChart.java
Adding chart controls
ITesterChartController interface allows the user to make changes on the chart during backtesting, like:
- change chart period and offer side,
- add indicators,
- add chart objects,
- change zoom. GUIModeChartControls.java
Change chart period
Consider creating a combobox for changing chart period:
class JPeriodComboBox extends JComboBox implements ItemListener {
    private JFrame mainFrame = null;
    private Map<IChart, ITesterGui> chartPanels = null;
    private Map<Period, DataType> periods = new LinkedHashMap<Period, DataType>();

    public void setChartPanels(Map<IChart, ITesterGui> chartPanels) {
        this.chartPanels = chartPanels;

        IChart chart = chartPanels.keySet().iterator().next();
        this.setSelectedItem(chart.getSelectedPeriod());
    }

    public JPeriodComboBox(JFrame mainFrame){
        this.mainFrame = mainFrame;
        this.addItemListener(this);

        periods.put(Period.THIRTY_SECS, DataType.TIME_PERIOD_AGGREGATION);
        periods.put(Period.FIVE_MINS, DataType.TIME_PERIOD_AGGREGATION);
        periods.put(Period.TEN_MINS, DataType.TIME_PERIOD_AGGREGATION);
        periods.put(Period.THIRTY_MINS, DataType.TIME_PERIOD_AGGREGATION);

        for(Period period: periods.keySet()){
            this.addItem(period);
        }
    }

    @Override
    public void itemStateChanged(ItemEvent e) {
        if (e.getStateChange() == ItemEvent.SELECTED) {
            if(chartPanels != null && chartPanels.size() > 0){
                IChart chart = chartPanels.keySet().iterator().next();
                ITesterGui gui = chartPanels.get(chart);
                ITesterChartController chartController = gui.getTesterChartController();

                Period period = (Period)e.getItem();
                DataType dataType = periods.get(period);

                chartController.changePeriod(dataType, period);
                mainFrame.setTitle(chart.getInstrument().toString() + " " + chart.getSelectedOfferSide() + " " + chart.getSelectedPeriod());
            }
        }
    }
Note: The combobox gets initialized in addControlPanel method and the setChartPanels call is made from the ITesterUserInterface.setChartPanels method.
Add indicators and chart objects
Consider creating two buttons - one for adding an indicator and the other for adding a horizontal line to the chart:
JButton addIndicatorsButton = new JButton("Add Indicators");
addIndicatorsButton.addActionListener(new ActionListener() {
    @Override
    public void actionPerformed(ActionEvent e) {
        getChartController().addIndicators();
    }
});
controlPanel.add(addIndicatorsButton);

JButton addVerticalLineButton = new JButton("Add Vertical Line");
addVerticalLineButton.addActionListener(new ActionListener() {
    @Override
    public void actionPerformed(ActionEvent e) {
        getChartController().activateVerticalLine();
    }
});
controlPanel.add(addVerticalLineButton);
Change zoom
Consider creating two buttons for changing chart's zoom:
JButton zoomInButton = new JButton("Zoom In");
zoomInButton.addActionListener(new ActionListener() {
    @Override
    public void actionPerformed(ActionEvent e) {
        getChartController().zoomIn();
    }
});
controlPanel.add(zoomInButton);

JButton zoomOutButton = new JButton("Zoom Out");
zoomOutButton.addActionListener(new ActionListener() {
    @Override
    public void actionPerformed(ActionEvent e) {
        getChartController().zoomOut();
    }
});
controlPanel.add(zoomOutButton);