User interface
This article describes the user interface of Desktop JForex3.
When you open Desktop JForex3 for the first time, the trading platform shows the default workspace.
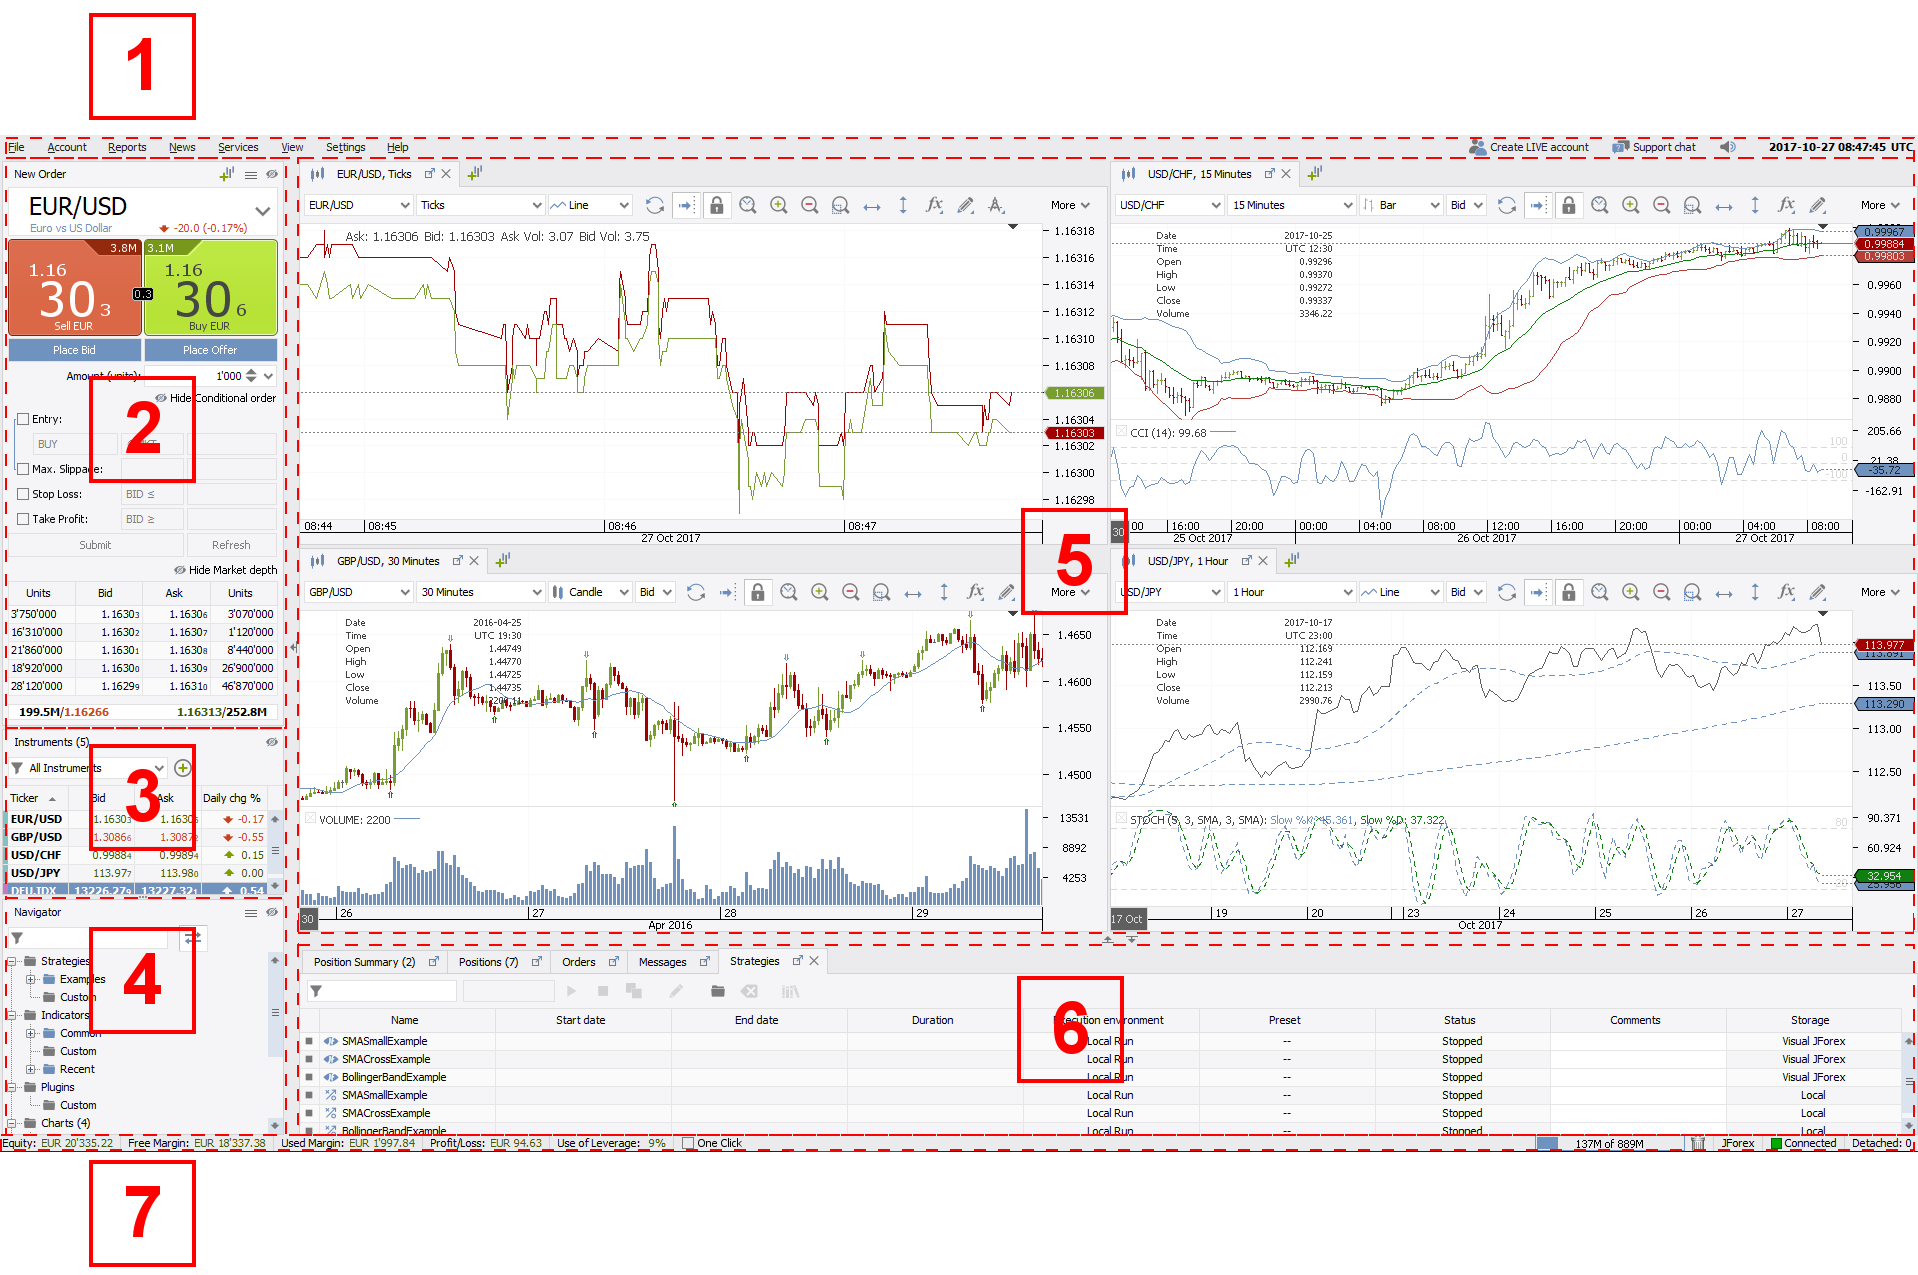
The user interface is divided into seven different functional areas.
- Menu bar (1) - at the top, providing access to reports, news, settings, the broker chat and other features.
- Order Panel (2) - on the left side, with the current quotes for the selected instrument and from which you can submit market and pending orders.
- Instruments (3) - on the left side, showing all instruments that you are subscribed to, their bid and ask prices and offering the possibility to add additional instruments to the workspace.
- Navigator (4) - in the lower left, providing an overview of open charts, strategies, indicators and other objects in the workspace.
- Charts (5) - in the center, with the toolbar offering features to change the instrument, time frame, side, add indicators or draw on the chart.
- Tabs (6) - in the lower center, displaying net exposure, open positions, pending orders and platform messages.
- Status bar (7) - at the bottom, showing your equity and use of leverage, among others.
Menu bar
The menu bar is located at the top of trading platform. It offers access to a variety of features which are described in brief below, the support chat and shows the current platform time.

- File - provides options to open, save or restore workspaces as well as to reconnect or exit the platform.
- Account - provides access to your account statements through which you can deposit funds or request withdrawals, check rollovers and commissions, change leverage settings or your password.
- Reports - provides access to your trading reports.
- News - opens/closes the tabs for the live economic calendar and the market news among others.
- Services - provides access to additional services such as notifications.
- View - opens/closes additional tabs and windows such as the Market overview, Historical Tester, Price alerter or the Strategies tab.
- Settings - allows to change the language, themes or the preferences of the platform.
- Help - provides access to the support chat and platform resources.
- Support Chat - opens the support chat window where you can chat with representatives of the broker.
 - mutes sound alerts.
- Platform time - displays the current platform time (right-click to change the time zone).
Order Panel
Via the Order Panel, located on the left side of the trading platform, you can submit market and pending orders, place bids and offers and check the market depth for the selected instrument.
Basic Order pane
The Basic Order Pane shows the currently active instrument, its bid and ask price and allows you to set the order amount, place bids and offers and use the instant order buttons.
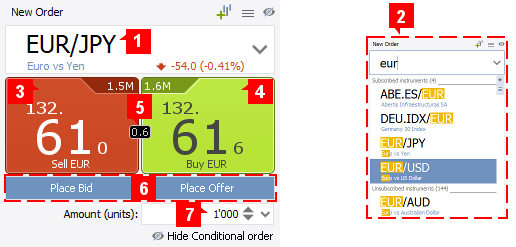
- Instrument Selector (1) - displays the symbol, name and daily net change (calculated on bid price) in both absolute and percentage values for the currently selected instrument. Click on the arrow in the selector or type the instrument name (2) to choose another instrument.
- Sell Instant Order button (3) - shows the bid price and available liquidity (top-right corner) for the first market level. Click on this button to submit a market sell order for the set amount.
- Buy Instant order button (4) - shows the ask price and available liquidity (top-left corner) for the first market level. Click on this button to submit a market buy order for the set amount.
- Spread (5) - the current spread for the instrument.
- Place Bid/Place Offer (6) - a click on Place Bid or Place Offer allows to place bids or offers.
- Amount (7) - here you can set the order amount. By default, it uses the value set in the preferences.
If One Click trading is enabled, market orders will be submitted directly without any further confirmation when you click on the instant order buttons.Conditional Order pane
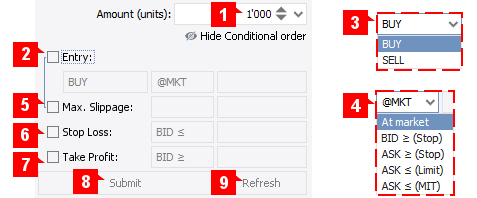
Via the Conditional Order Pane you can place a variety of entry orders (Market, Stop, Limit or MIT), define order conditions and add associated take profit and stop loss orders upon order creation.
-
Amount (1) - here you can set the order amount. By default, it uses the value set in the preferences.
-
Entry (2) - click on Entry to set the order side (3) and to choose the order type (4). For all entry orders except market orders, you need to define the trigger price. For stop entry orders, the trigger can be on the BID or ASK side (execution price defined by the relevant order side).
-
Max. Slippage (5) - slippage control. If it is not possible to define a slippage restriction for the entry order, the option is greyed out (Limit orders).
-
Stop Loss (6) - add a stop loss to your entry order. The trigger price can be set on either the BID or ASK side (execution price defined by the relevant order side).
-
Take Profit (7) - add a take profit to your entry order.
-
Submit (8) - once you have set all order conditions, click on Submit to send your order(s). If One Click trading is enabled, the order(s) are submitted directly. If it is disabled, the orders preview pops up with the order conditions which gives you the possibility to review the order conditions before submitting.
If there is a risk of immediate order execution upon order submission for the conditional orders (meaning all orders except market orders) and if Orders Validation is enabled in the preferences, a warning message pops up asking if you want to proceed or not.
-
Refresh (9) - upon checking the Entry box, the price input fields display a predefined price (which can be changed). This price is derived from the current market price and the default distance values for entry, stop and take profit orders as set in Instruments. The Refresh button updates the price input fields by using the current market price.
Market depth
The Market Depth pane shows the liquidity that is available for the instrument at the current moment.
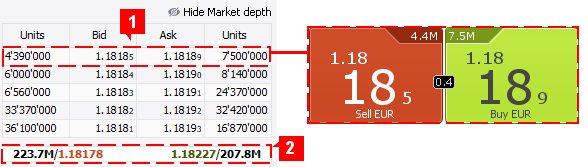
The price and available amount for the first level is the one that is shown for the instrument on the instant order buttons (1) (and on the tick charts).
By default, the pane displays 5 levels, but it can show up to 10 (right-click anywhere on the market depth section to switch between 3,5 and 10 levels).
Total liquidity for the instrument (which can exceed 10 levels) and the average weighted price is displayed in (2).
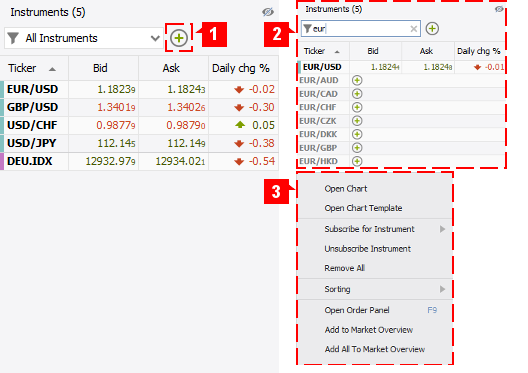
Instruments
The Instrument pane shows all instruments which you are currently subscribed to, their bid and ask prices as well as the daily net change.
For each subscribed instrument, the platform receives price data. If you select an instrument in the Order Panel or the chart that you are not subscribed to yet, the platform automatically adds it to the list of subscribed instruments.
Click on an instrument to select it as the active one in the Order Panel. If you click on a chart or on the chart tab, the instrument of the chart becomes also the active instrument in the order panel.
To subscribe to a new instrument, click on (1) and select it from the list. You may also type the name of the instrument in the search field (2). Unsubscribed instruments are greyed out. Click on the  button to subscribe to them.
A right-click on an instrument provides additional options (3). To add a new chart, select Open Chart. To remove an instrument, select Unsubscribe Instrument.
Subscribing to a large number of instruments may negatively affect platform performance. In that case, it may be advisable to remove instruments from the list (only unused instruments can be removed).Navigator
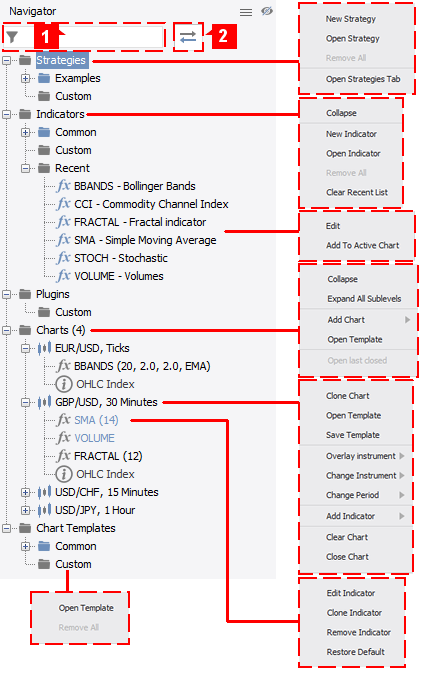
The Navigator window, in the lower left, provides a tree-structure-overview of your workspace, allowing to quickly manage strategies, indicators, plugins, charts and templates.
Right-click on a category (e.g. Charts) or an object (e.g. EUR/USD, Ticks) to access further options. Certain objects such as indicators can be dragged and dropped directly onto a chart.
To search for an object, type the name in the search field (1). If Link with other panels (2) is switched on, the Navigator will switch to the chart or strategy that is selected in the workspace.
Charts
By default, the platform displays four tiled chart windows.
In order to maximize a single chart, simply double-click the chart tab (here EUR/USD, 1 Minute) or right-click the chart tab and select Untile from the menu.
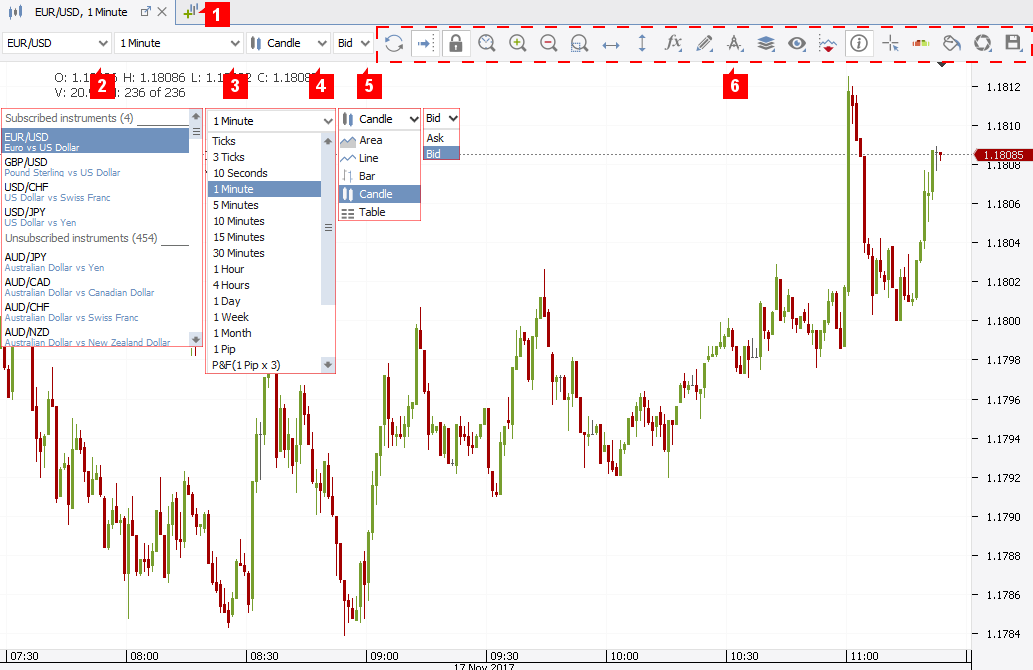
Add a new chart by clicking on (1).
Open the drop down menus to change the instrument (2), time frame (3) and the display mode (4).
The trading platform offers conventional time based charts as well as price based charts. The smallest time unit are ticks which are displayed for both bid and ask prices simultaneously. For other time frames, you need to choose the bid or ask side (5).
To show or hide different chart layers such as historical orders, positions, pending orders or indicators, click on the chart layer icon ( ).
).
The icon bar (6) above the chart provides access to the following functions:
 Reload - reloads the charts.
 Set Chart Autoshift - enables the chart autoshift which keeps the chart moving to the right with the pricefeed.
 Free/Lock Mode - if the chart is in lock mode, it can only be shifted to the the right/left, not up or down.
 Select Custom Range - allows you to jump to a specific date/time.
 Zoom - zoom in/out.
 Time/Price Markers adds a price/time marker to the chart. Double the marker to shift it or right-click to access further options.
 Indicators - opens the indicator window where you can select, edit and add indicators to the chart.
 Drawings/Retracements - add lines, channels, retracements to the chart.
 Overlay - overlays another instrument on the current chart.
- Chart layers - show/hide different layers (pending/historical orders etc.) in the chart.
 Patterns - after accepting the disclaimer, you can have the chart scanned for specific patterns.
 OHLC - adds/removes the OHLC window from the chart.
 Cursor pointer - turns the cursors into a crosshair showing the price and time on the respective axes.
 Order Widget - shows/hides the order widget in the chart.
 Chart themes - opens the theme menu which defines the look of the chart.
  Save Chart as Image - you can save the chart to clipboard, as a file or print it.
 Templates - provides options for handling templates.
Tabs
In the default workspace, the trading platform shows five tabs: the Position Summary, Positions, Orders, Messages and Strategies. If you use other tools such as the Historical Tester or the Live Economic Calendar, additional tabs are added
Position Summary
The Position Summary displays the net exposure for all instruments with (an) open position(s). A right-click on an instrument provides options to close or merge all positions of the instrument.
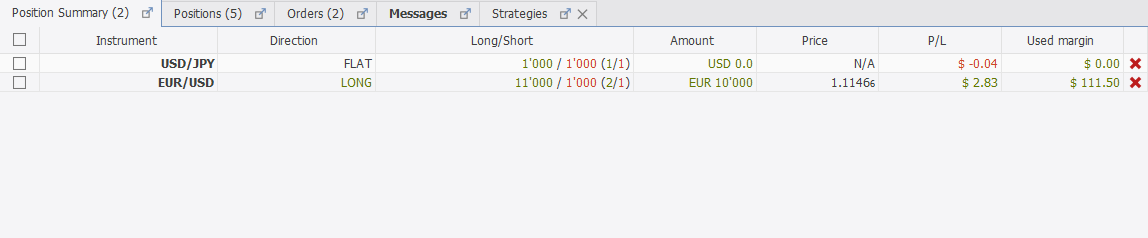
- Instrument - trading instrument.
- Direction - direction of the net exposure. If total position size is greater for long positions than for short positions, the net exposure is LONG. In the opposite case, the net exposure is SHORT. If total position size for long and short positions is equal, net exposure is FLAT.
- Long/Short - shows the total position size for each direction and the number of long and short positions.
- Amount - net exposure amount.
- Price - (average weighted) opening price of the net exposure.
- Used Margin - margin in account currency that is used by the net exposure. Instruments may have individual margin requirements.
- P/L - profit or loss in the account base currency.
Positions
The Positions tab shows all currently open positions. Once a position is closed, it is no longer shown here. If the position has a stop loss or take profit order assigned, the order conditions are shown in the respective column. Right-click a position to open the menu with options to close the position, add or edit stop loss and take profit orders.
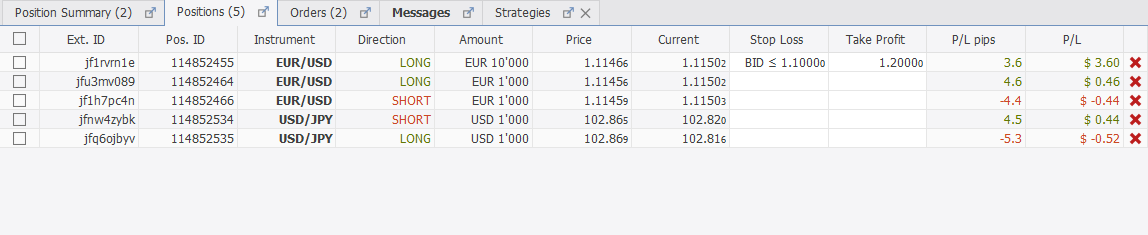
Right-click a position to open the menu with options to close the position, add or edit stop loss and take profit orders.
-
Pos. ID - unique position ID.
-
Instrument - trading instrument.
-
Direction - direction of the position.
-
Amount - position size.
-
Price - opening price of the position. If the position stays open overnight, the opening price in the position tab is adjusted to reflect the impact of the swap on the positions profit and loss.
-
Current - current price which is used for the profit and loss calculation
-
Stop Loss - trigger price of the stop loss assigned to the position (if any).
-
Take Profit - trigger price of the take profit assigned to the position (if any).
-
P/L pips - profit and loss in pips.
-
P/L - profit and loss in the account currency.
The PL displayed in the account currency is indicative and it may differ from the actual settled PL if the instrument’s secondary currency differs from the account currency. The indicative PL of a position is the current PL in the secondary currency of the instrument converted into the base currency of the account at the market rate. The settled PL, in its turn, is the PL in secondary currency converted into the account currency at the rate of the corresponding settlement date, such rate is also adjusted by the markup specified on the Trading Fees page of the Dukascopy website.Note that in case that the position is held open overnight, its settled PL will be separately calculated and converted to the currency of the account every day the position was open. Over time, this creates room for an accumulated mismatch between the settled PL and the indicative PL of the position seen in the platform. In some cases this mismatch may even lead to these 2 PLs having different signs, although the absolute value of the difference in the majority of the cases is inconsiderable. -
Comments - comments (can be added in the Orders tab when an order is in Pending status)
Orders
The orders tab displays all active and pending orders until they are executed, or otherwise canceled.
Right-click an order to edit or cancel the order. You may also add stop loss or take profit orders to pending entry orders and group entry orders to OCO.
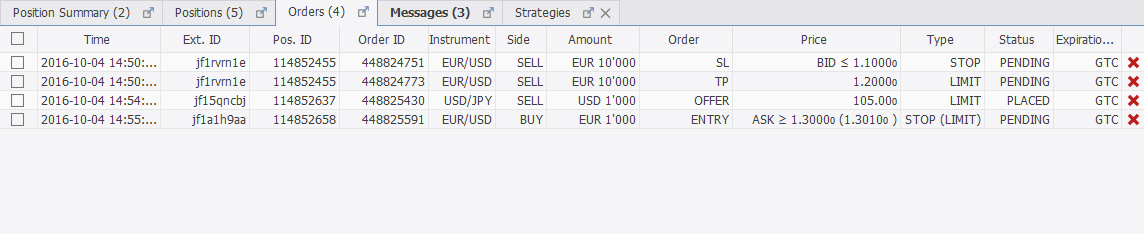
- Time - date and time order had been added.
- Pos. ID - ID number that would be attributed to the position in case of execution. Associated orders (Stop Loss and Take Profit) use the position ID of the entry order. All orders have a position identification number attributed, even pending orders.
- Order ID - unique order ID.
- Instrument - trading instrument.
- Side - BUY or SELL.
- Amount - order amount. For associated orders, the amount of the associated position or entry order.
- Order - order, can be ENTRY, IFD SL (stop loss), IFD TP (take profit), BID, OFFER.
- Price - trigger price and constraints on the execution price.
- Type - displays the order type (STOP, LIMIT, STOP (LIMIT))
- Status - current status, can be PENDING, EXECUTING or PLACED (BID/OFFER).
- Expiration (UTC) - expiration date, can be a date (Good Till), duration (Good for) or good-till-cancelled (GTC). If orders are grouped to OCO, an additional entry is added.
- Comments - allows to add comments to pending orders.
Executing status must be resolved as soon as possible. In case orders stay in executing status after reconnection attempt and/or restart of the platform, the client must immediately contact the broker to get a confirmation about the current status of the order.Messages
The message tab shows all messages that are generated while you are connected to the trading platform (connection, order filled or sent, etc.).
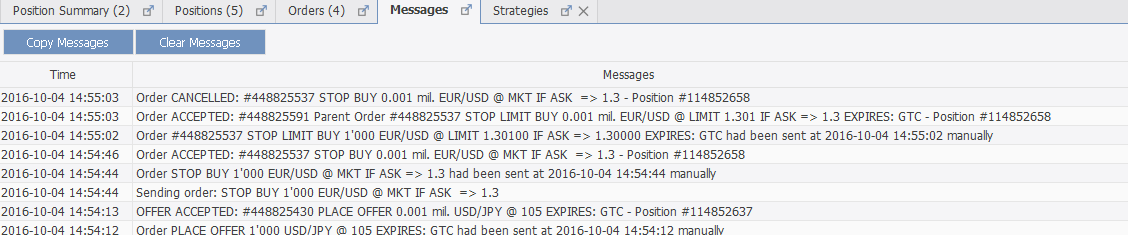
Historical records can be accessed through the Activity Log (Go to the menu bar in the top left, Reports > Activity Log).
Status bar
The status bar at the bottom of the platform helps you to monitor your equity and use of leverage in one glance.

At platform level, the equity is updated in real time on every received price tick (JF3) or in regular intervals (other trading platforms and reports). However, the equity at the server level is updated in true real time in order to secure the timely implementation of margin maintenance requirements.
- Equity - shows your current equity in the account base currency considering trading profits and losses of open and closed positions, debit/credit operations on the account as well as commissions, fees and the impact of mark-to-market conversion.
- Free Margin - displays how much margin is available to open/maintain new exposures.
- Used Margin - shows the margin that is reserved to maintain exposures.
- Profit/Loss - shows the combined profit or loss in the account base currency from all currently open positions.
- Use of leverage - is an indicator showing how much of the equity is currently used as margin by the exposure on the trading account. At 100% all your equity is used as margin.
Be aware of the margin call and margin cut policies. At 100% use of leverage you are not allowed to increase the exposure on the account while at 200% - the system may either open counter positions to bring the use of leverage back to 100% or close exisiting positions (subject to your margin mode settings). - One click - allows you to switch on/off the one click trading mode. If One Click is enabled, orders are submitted directly without any further confirmation (both market and pending orders). It is advisable to disable this function.
Besides information on your equity and margin use, the stats bar displays also the following information:
- JForex - shows the name of the workspace (in this case JForex). A right-click on the name opens the workspace options (Open/Save/Restore etc.)
- Connected - shows if the platform is connected.
Even when the platform shows Connected status, continue to check thoroughly platform messages especially during order submission. - Detached - counts all detached windows which are not part of the main trading platform (e.g. charts).