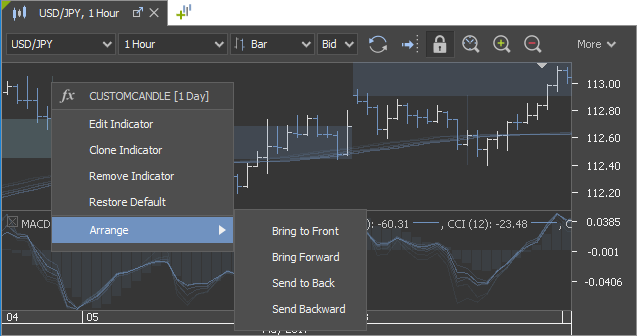
What's new?
New indicator: Price Volume Trend
Available since version 3.6.31, 01.Feb 2021New Volume indicator: Price Volume Trend (PVT)
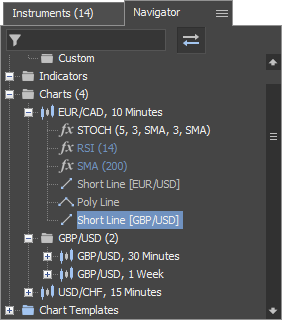
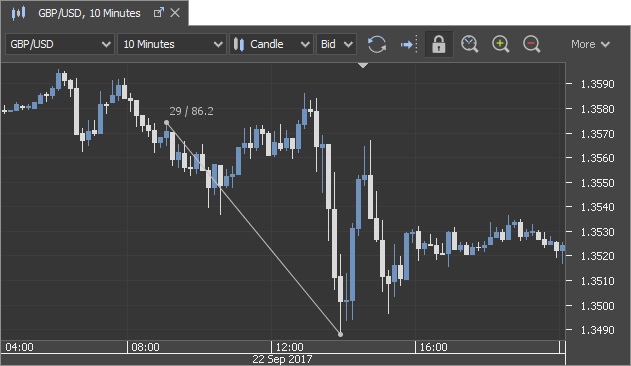
Central point for Short line
Available since version 3.6.29, 6.Jan 2021Short line has a central point now.
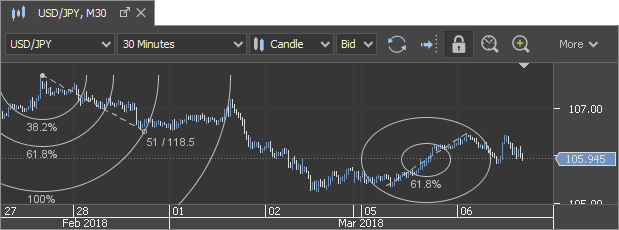
Ellipse rotation
Available since version 3.6.29, 6.Jan 2021Ellipse can be rotated now.
Hide labels for PIVOT
Available since version 3.6.27, 12.Nov 2020It is possible to hide the labels for PIVOT2, WOODPIVOT2, FIBPIVOT2, CAMPIVOT2 indicators. Edit the indicator and uncheck "Show labels" in Input section.
Max Ticks per bar 10'000
Available since version 3.6.22, 18.Aug 2020The max limit of ticks per bar is increased to 10'000
Linear regression channel
Available since version 3.6.19, 21.May 2020New indicator: Linear Regression Channel has been added.
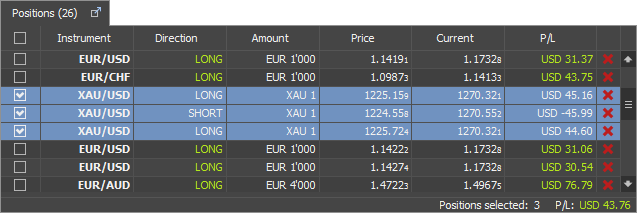
Comments for Positions
Available since version 3.6.14, 24. Mar. 2020Comments can be added and edited for positions as well now.
Period zone highlight
Available since version 3.6.14, 24. Mar. 2020The zone of the input from which the indicator is calculated can be shown in chart now. It can be enabled in Edit indicator window under Advanced section.
New indicator: McGinley Dynamic
Available since version 3.6.14, 24. Mar. 2020McGinley Dynamic indicator has been added.
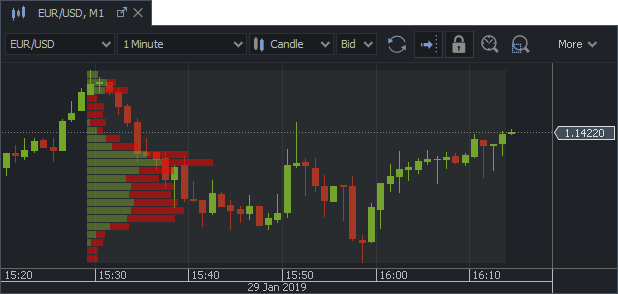
Trading breaks filter in charts
Available since version 3.6.11, 24. Mar. 2020Treading breaks (flat candles) in charts are filtered based on the calendar in database for each instrument individually.
New indicator: Gaussian Channel
Available since version 3.6.11, 24. Mar. 2020New indicator - Gaussian channel - has been added.
Schiff Pitchfork
Available since version 3.6.8, 15. Nov. 2019Schiff Pitchfork and Modified Schiff Pitchfork has been added.
New indicator: Net Exposure
Available since version 3.6.8, 15. Nov. 2019Net exposure can be shown in the chart with the help of a new indicator: NET_EXPOSURE
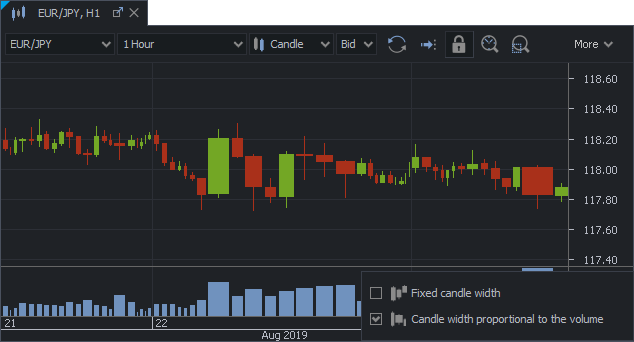
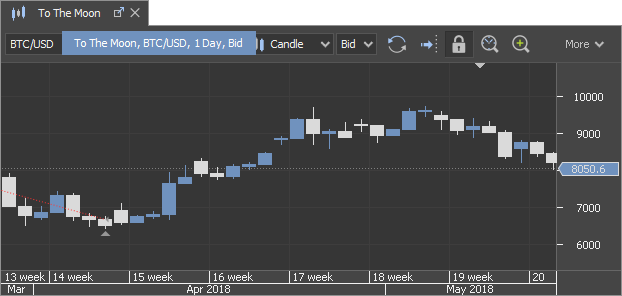
Candles proportional to Volume
Available since version 3.6.6, 30. August 2019Candles and bars can be displayed with width proportional to the volume. Right click on the time scale to change.
E-mail on price alert trigger
Available since version 3.6.5, 27. August 2019It is possible to receive an email when the price alert is triggered. Enable and set an email address in the settings of the price alerts panel.
Move indicators
Available since version 3.6.5, 27. August 2019Indicators can be moved to different panes now. Use the newly added context menu item: Move to. Or select the indicator with one left mouse click and drag. Drop on the red line which is drawn at the bottom or the top of the main or sub pane or inside the other sub pane to move it in there.
Indicators, which used to be shown on the main chart pane only, like HEIKINASHI, can be moved to the sub pane now.
Patterns
Available since version 3.6.2, 19. July 2019A new button has been added in the chart toolbar: Patterns
The following objects can be drawn:
- XABCD
- ABCD
- Triangle pattern
- Head and Shoulders
- Elliott Impulse Wave (12345)
- Elliott Triangle Wave (ABCDE)
- Elliott Triple Combo Wave (WXYXZ)
- Elliott Correction Wave (ABC)
- Elliott Double combo Wave (WXY)
Custom colours for order labels
Available since version 3.6.2, 19. July 2019The following order lines and labels can be customized in chart theme:
- Bid
- Buy Limit
- Buy Stop
- Buy MIT
- Long Position Stop Loss
- Long Position Take Profit
- Offer
- Sell Limit
- Sell Stop
- Sell MIT
- Short Position Stop Loss
- Short Position Take Profit
VAL, VAH and POC for Volume profile
Available since version 3.6.2, 19. July 2019Value Area Low, Value Area High and Point of Control have been added to Volume profile indicator.
Undo/Redo chart objects
Available since version 3.6.2, 19. July 2019Undo/Redo buttons have been added in chart toolbar. It is possible to undo the last 5 changes made with drawing objects or indicators.
Remove linked chart objects
Available since version 3.6.2, 19. July 2019If there are objects drawn in the chart, which are linked to another instrument, there is a yellow warning shown in the left corner of the chart. These objects can be removed if the label is clicked.

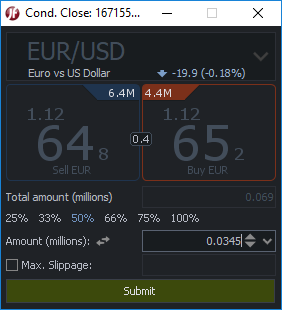
Partial conditional close
Available since version 3.6.2, 19. July 2019There are few labels added in the conditional close dialog for more convenient partial amount selection.
New indicators
Available since version 3.5.15Few indicators have been added:
- Fractal Adaptive Moving Average (FRAMA) indicator
- Weis Waves (WEISSWAVE)
- Weis Waves Zig Zag (WEIS_ZIGZAG)
A new output has been added to ZigZag indicator: Volumes AD line indicator has been listed as unstable indicator.
Swaps
Available since version 3.5.14Accumulated swaps of the open positions are shown in the new column of the Positions table. Right click on the table header to enable it.
Auto-launch strategies
Available since version 3.5.12It is possible to run the strategies automatically when the platform starts. There is a new column added in the Strategies panel: Auto launch
Non-linear time charts
Available since version 3.5.12The drawing objects in non-linear time scale charts (price based charts) can be drawn behind the current candle (in the future). The time scale of the future is extrapolated from the historical data.
Please note that objects drawn not horizontally or vertically can change the angle each time a new candle appears if one of the coordinates is set in the future.Amount calculator
Available since version 3.5.9Amount calculator can be used to calculate the exact amount of the order to achieve certain results.
Find the small icon next to the amount spinner in different places across the platform to open it.

Use the switch button to switch from the account currency to the "% from Equity".
Use the buttons bellow the amount spinner for rounding the result up or down gradually.
The information about the pip value, amount multiplicator (for CFDs on commodities) and daily swaps is shown based on the amount calculated.
Selection of charts objects
Available since version 3.5.9Charts objects can be selected with a single left mouse button click now. Chart is expanded with the double click in case there is at least one indicator's sub-panel.
Warnings in spinners
Available since version 3.5.9There are 2 type of warnings shown in the amount and price spinners:
 Red - when the value is not correct
 Yellow - when the price is in the trigger zone
Several instances of plugins
Available since version 3.5.9Several instances of plugins can be launched now. They can be managed in the Navigator.
Distance to current price
Available since version 3.5.9There is a new label added in the chart, which displays the distance of the order's price to the current market price. It is shown when the mouse cursor is on the order's line.
Scale of indicators
Available since version 3.5.9In case there are several indicators in one sub-panel, the second indicator will be shown with its own scale located on the left side of the chart. Right click on the scale to hide it or to show both on one scale.
Move the indicators
Available since version 3.5.9Indicators can be moved from the main chart area into the sub-panel or between the sub-panels with the Drag&Drop. Single click to select the indicator before doing this.
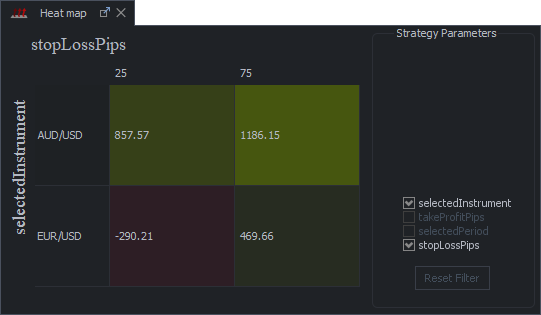
Heat map and new optimization types
Available since version 3.5.4There have been new optimization methods added to the Historical tester in this version:
- Montecarlo
- Genetic
Both of them are available in the optimization settings. Heat map of the optimization combinations results is available there as well.
DDE Quotes
Available since version 3.5.4A new plugin is available in Navigator/Plugins/Examples: DDEQuotesPlugin. If activated on Windows OS, the price quotes are sent to the Excel .xls and .ods files.
New indicators
Available since version 3.5.42 simple indicators have been added:
- WEEKDAYS
- TRADINGSESSIONS
WEEKDAYS shows when each day of the week starts and ends on the chart. TRADINGSESSIONS shows when the trading in Sydney, Tokyo, London and New York starts and ends.
Hide vertical grid
Available since version 3.5.2Vertical grid lines can be hidden in charts. Enable a new setting "Hide vertical grid" in Preferences/Charts.
TimeTillCandleClose plugin
Available since version 3.5.2There is a new plugin available in Navigator/Plugins/Examples: TimeTillCandleClosePlugin. It shows the time till the candle close visually on the chart. It is not possible to run several instances of any plugin unless it is being edited, saved with unique name, compiled and activated now. We will improve this in the future versions.
Price input methods
Available since version 3.5.0There are several new price input methods added in this version:
- points
- % from price
for setting Stop Loss and Take Profit orders.
% from price is being calculated from the current market price in case of the market order type and from the entry order price in case of all the other types.Day's range
Available since version 3.5.0Day's range is showing the current day's range. It displays the range from the High Ask till the Low Bid. The opening Bid and current Bid are displayed withing this range as a bullish or bearish horizontal line. The time zone is taken from the Day start time setting in the Preferences/Chart section.
This feature can be enabled in the menu of the New order panel, New order widget (chart) or Market overview.
Volume profile
Available since version 3.5.0Volume profile is available as a drawing object from the chart's menu and as an indicator. The indicator VOLUME_PROFILE displays the volumes in sessions. The length of the session (base period) can be changed in the Advanced sttings of the indicator.
High/Low price labels
Available since version 3.5.0High and low price labels are available in charts now. Enable them under the layers menu or use Ctrl+E hot key.

Thin charts
Available since version 3.5.0The price lines in all chart types are changing in width automatically, when zoomed in.
This can be disabled with the new setting Thin charts which is available in Preferences/Chart.
Sentiment Index
Available since version 3.4.14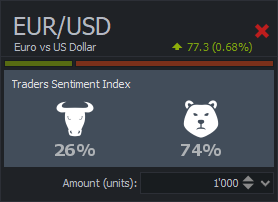
Move the cursor over the line to see its values.
Customizable status bar
Available since version 3.4.14The information in the status bar of the main frame can be customized from the context menu.
Order editing from chart
Available since version 3.4.14Take profit and Stop loss orders price levels can be moved together with the entry order now. Move the entry order with drag&drop of the left label (with the dots). In case the price of the entry order has to be changed alone, double click the entry order's line and move it to the new level.
Pop-up notifications
Available since version 3.4.14The pop-up notifications have been redesigned. Price alerts are shown there as well now.
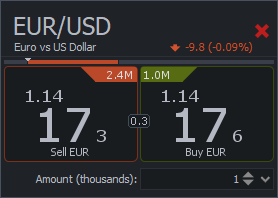
Exposure
Available since version 3.4.14A new column has been added in Positions summary: Exposure
It shows the exposure of each instrument in account currency.
Pencil
Available since version 3.4.14There is a new drawing object added in the charts: Pencil
Left click to draw and double click (or press Enter or Esc) to exit the drawing mode.
Fibonacci Channel
Available since version 3.4.14Fibonacci channel has been added under the retracement tools.
Arrange the indicator's outputs
Available since version 3.4.14The outputs of the indicator can be arranged now. Open the "Edit indicator" dialog and drag the outputs by name to change their order.
More inputs for KDJ
Available since version 3.4.14The multipliers of the K and D values have been added to the KDJ Random index.
Copy/Paste of chart objects
Available since version 3.4.13Drawing objects and indicators can be copied and pasted in the same or other chart.
Link between Market overview and charts
Available since version 3.4.12Market overview can be linked to the chart group now. If linked, selecting the instrument in Market overview will switch the instrument in chart (linkage by instrument must be enabled).
Exposure widget
Available since version 3.4.8The exposure of the positions open can be viewed in the all new Exposure widget. It can be open from the View section of the main menu or from the toolbar of the Positions or Summary tables.
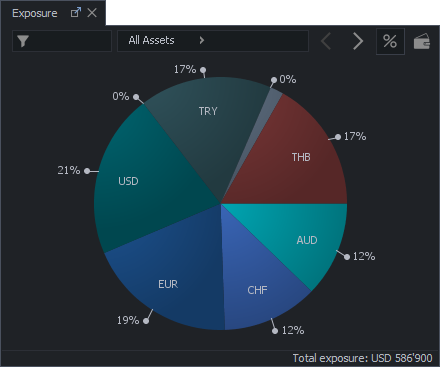
There are 3 exposure levels:
- Assets
- Instruments
- Positions
Left-click on each sector to enter the next level or right click to go back. It is possible to include the balance in the calculation as well.
Close all positions
Available since version 3.4.8There is a new button available in the Positions or Summary panels: Close all positions. Right click on the tab to enable this button in the Toolbar section. It is hidden by default to avoid accidental usage.
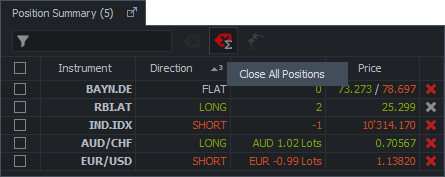
The function will close all the positons open in one click in case "One click" feature is enabled. Please use with caution!Cancel all orders
Available since version 3.4.8There is a new button available in the Orders panel: Cancel all orders. Right click on the tab to enable this button in the Toolbar section. It is hidden by default to avoid accidental usage.
The function will cancel all the pending orders in one click in case "One click" feature is enabled. Please use with caution!Link with other panels
Available since version 3.4.8There is a new button available in the Positons, Summary and Orders panels: Link with other panels. Right click on the tab to enable this button in the "Toolbar" section.
This button toggles the linkage between different panels or widgets in the platform.
If enabled:
- Selecting the row in the Summary, Positions, Orders, Instruments or Navigator (chart node) panels will set the same instrument in the New order panel on the left side of the platform.
- Summary panel is linked with Positions and Orders panels. Selecting the row will select the position(s) in the Positions table and select the order(s) in the Orders table.
- Positions panel is linked with Order panel. Selecting the row will select the linked order(s) in the Orders table.
- Navigator panel is linked with charts, Strategy editor and Strategy panel. Selecting the object in the chart node will find and select the object in the chart. Selecting the strategy will select it in the Strategy panel as well.
- Charts are linked with Navigator panel. Selecting the objects in chart will select them in the Navigator. Setting the focus on the chart will select the node in the Navigator.
Drake Delay Stochastic
Available since version 3.4.8New indicator has been added: Drake Delay Stochastic (DDS)
Tab change hot key
Available since version 3.4.8Use Ctrl + Page up/down to change the tabs within one tabbed pane.
High Charting accuracy
Available since version 3.4.6There is a new setting available in Preferences/Chart: High Charting accuracy. If disabled (by default), there are much more zoom levels in the charts, but less accuracy as the distance between the candles/bars may vary. The distance will be equal if this setting is enabled.
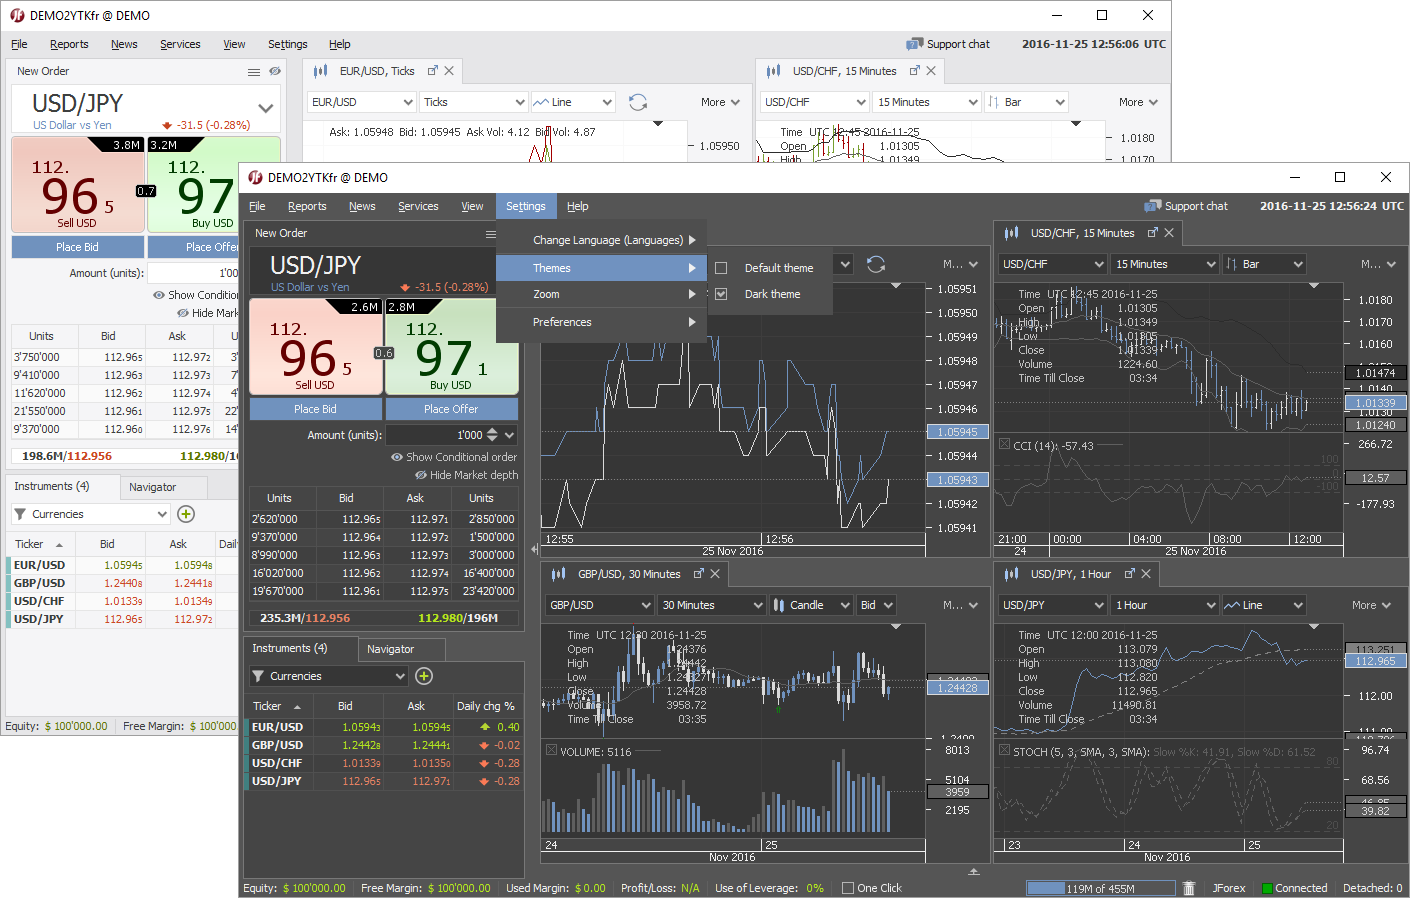
Dark Blue theme
Available since version 3.4.6New platform theme - Dark Blue - is available. It is possible to use it if platform is launched by webstart or if the installation version is upgraded to version 2.12.
Bulish and Bearish Volume
Available since version 3.4.62 new outputs have been added to VOLUME indicator:
- Bullish volume (Close > Open)
- Bearish volume (Close < Open)
If enabled, the colour of the volume bars depends on the open and close prices.
Orders Mirror plugin
Available since version 3.4.5Orders Mirror plugin is available in this version. Right click on the plugin in Navigator/Plugins/Examples to activate it.
The plugin allows to place a set of entry orders at the defined distance from each other and the similar orders on the other side of the current market. Each pair of orders (a set) can be grouped as One Cancels the Other (OCO).
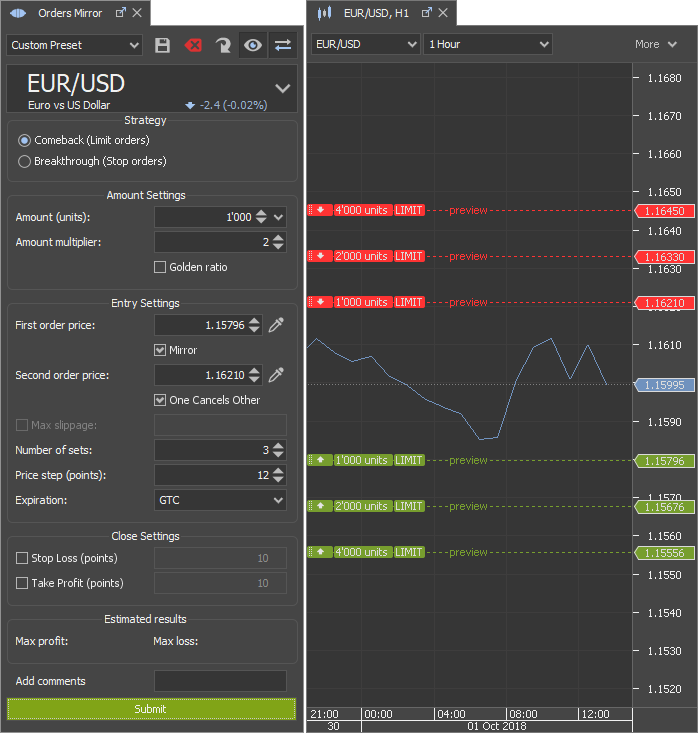
Below is a short description of the main parameters:
- Amount - amount of the entry orders in the first set
- Amount multiplier - a multiplier of the amount. Amount = Amount of the orders in previous set x Amount Multiplier
- First order price - the price of the order in the first set. Price picker can be used to pick the price from the chart
- Second order price - the price of the second order in the same set on the opposite side of the market. Price picker can be used to pick the price from the chart
- Number of sets - 2 entry orders, each on its own side of the market, create a set. This setting defines the number of the sets.
- Price step - the distance between the entry orders on one side of the market
- Add comments - adds same comment for every entry and close order placed
Estimated results show the maximum possible trading result excluding the trading commissions and rollovers.The plugin can be docked in one of the three parts of the platform:
- Top (Chart area)
- Left (New and Conditional order area)
- Bottom (Positions, Orders table etc. area)
Orders can be previewed on any of the charts with the same instrument selected if the  button is enabled in the toolbar.
Instrument can be selected by click on any chart if  button is enabled.
Fixed auto-shift
Available since version 3.4.3There is a new setting added under Preferences/Chart section: Fixed Auto-shift Position. If enabled, it shows the small triangle in the top of each chart, which can be used to fix the position of the current candle auto-shift. If not, the chart can be returned to the current candle with the help of the button in the bottom right corner of the chart, button in the toolbar or a hot-key (End key by default).
Orders preview layer in charts
Available since version 3.4.3Orders preview can be shown or hidden with the help of the Chart layers section, where a new layer has been added.
Multi-selection of the drawing objects
Available since version 3.4.3Drawing objects can be multi-selected in the chart. Hold Shift while selecting the objects in the chart with the mouse left button pressed or hold and use mouse left double click to select. Multi-selected objects can be moved around, deleted or, if the objects are of the same kind, the context menu can be used to edit them.
Toolbars for tables
Available since version 3.4.3Position, Position Summary and Orders tables have a toolbar now. Quick filter has been added there to filter the content. It works with every value used in the table, e.g. type in "ENTRY" in Orders table to see the entry orders only.
Orders Grid plugin
Available since version 3.4.0Orders Grid plugin is available in this version. Right click on the plugin in Navigator/Plugins/Examples to activate it.
The plugin places a group of Limit or Stop entry orders at the defined distance from each other.
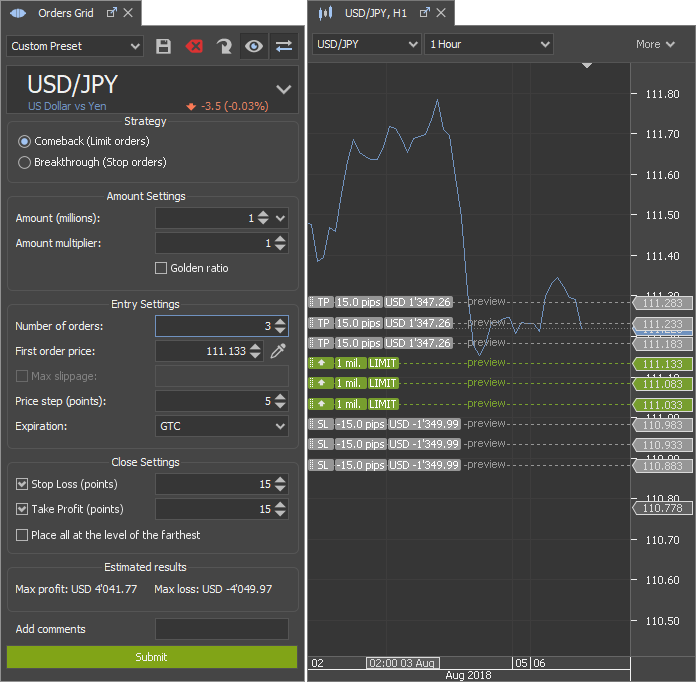
Below is a short description of the main parameters:
- Amount - amount of the first entry order in the group
- Amount multiplier - a multiplier of the amount for the next entry order in the group. Amount = Amount of the previous order x Amount Multiplier
- Number of orders - number of entry orders in the group
- First order price - the price of the first order. Price picker can be used to pick the price from the chart
- Price step - the distance between the entry orders in the group
- Place all at the level of the farthest - Take profit and Stop Loss orders can be placed at the level of the farthest close order in the group
- Add commnets - adds same comment for every entry and close order in the group
Estimated results show the maximum possible trading result excluding the trading commissions and rollovers.The plugin can be docked in one of the three parts of the platform:
- Top (Chart area)
- Left (New and Conditional order area)
- Bottom (Positions, Orders table etc. area)
Orders can be previewed on any of the charts with the same instrument selected if the button is enabled in the toolbar.
Instrument can be selected by click on any chart if button is enabled.
Max. Slippage on charts
Available since version 3.3.16Max. Slippage is shown on the chart when the STOP or MIT order line is highlighted.
Orders preview in chart
Available since version 3.3.16The preview of the orders in the chart has been changed. The estimated P/L is shown there as well.
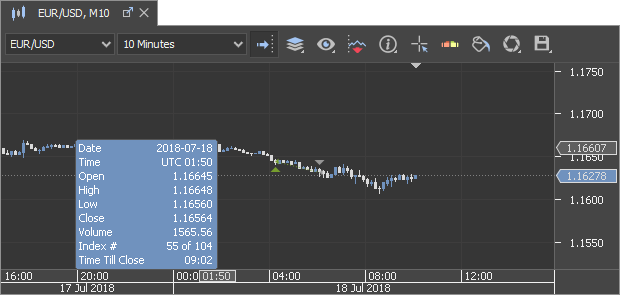
OHLC index as a tooltip
Available since version 3.3.16OHLC index can be shown as a tooltip as well now.
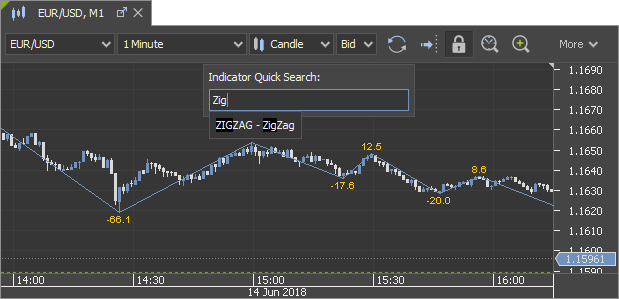
Quick search of Indicators
Available since version 3.3.14The quick search of the indicator has been added in charts. It has F4 hot key by default.
Distance in ZigZag
Available since version 3.3.14Distance in points can be shown in ZIGZAG indicator. Enable it under output settings.
Historical levels of the Pivots
Available since version 3.3.14Historical levels of the FIBPIVOT, WOODPIVOT and CAMPIVOT indicators can be disabled now under the input settings.
Chart autoshift
Available since version 3.3.14Autoshift of the chart enables automatically in case the chart is scrolled to the place, where the current candle is. It disables if the current candle is not shown or the drawing objects get drawn.
The triangle on top of the chart, which shows the place of the current candle, moves with the current candle now if the chart is scrolled to the left.
Chart zoom in/out
Available since version 3.3.14Chart can be zoomed in/out with the mouse wheel now. It can be scrolled with the mouse wheel if Ctrl is hold.
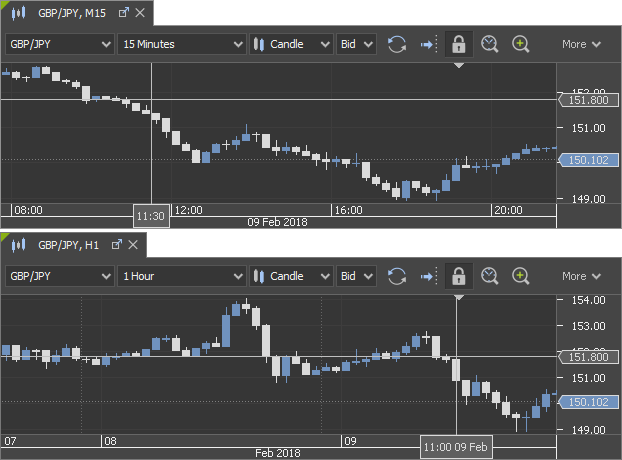
Linked chart scrolling
Available since version 3.3.14Linked charts scrolling can be synced now.
Rename chart
Available since version 3.3.12Charts can be renamed. Pop-up shows the additional information if mouse is over.
More Shortcut keys
Available since version 3.3.11More shortcut keys can be added now in Preferences/Hotkeys section. Including all the indicators and chart drawing objects.
Custom chart toolbar
Available since version 3.3.11Chart toolbar can be customized or hidden completely. Right click on the chart tab and open Toolbar section to customize it.
New indicators
Available since version 3.3.11New indicators have been added:
- ASKBIDVOLUMES - it shows the volumes of both - best bids and offers - and compares them.
- SUPERTREND - Supertrend indicator
- SMALL_CANDLES - Less than 50% Candle body indicator
- ADR - Average Daily Range
Chart autoshift hotkey
Available since version 3.3.8Chart auto-shift can be enabled/disabled using "End" key on Windows and Linux OS. Fn + → on OS X.
Default chart template
Available since version 3.3.7Each chart with its objects can be set as a default now. If set, new charts will open with the same objects.
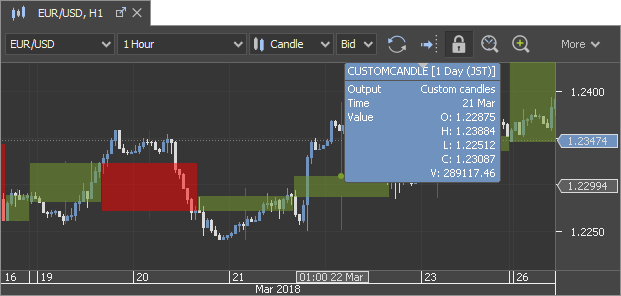
Custom time zone candles
Available since version 3.3.7It is possible to set a time zone for the periods of more than 2 hours in CUSTOMCANDLE indicator. It can be used to show the e.g. daily candles in different time zone, while the main chart remains in e.g. UTC. It can be done under Advanced settings/Calculate from custom data.
Retracement objects background
Available since version 3.3.7Background can be set for different retracement drawing objects.
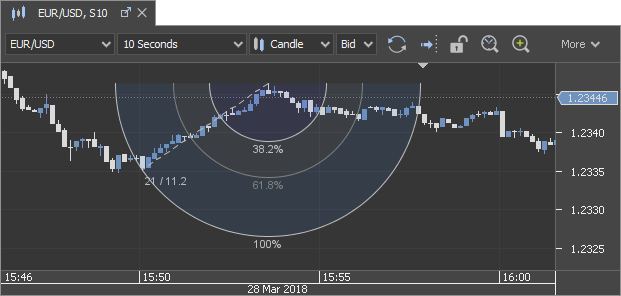
Chart object display periods
Available since version 3.3.4Display periods of drawings and retracements are shown in Navigator now, if they do not match the period selected on the chart.
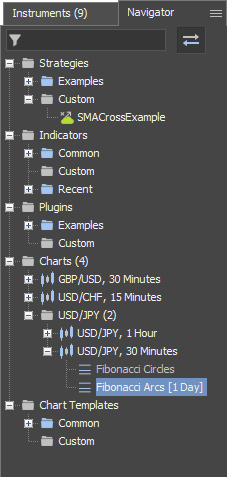
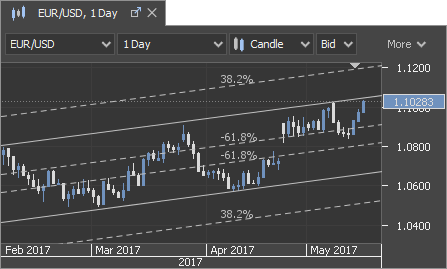
Fibo Arcs and Circles
Available since version 3.3.4Fibo Arcs have been improved and Fibo Circles added.
Cursor pointer synchronization
Available since version 3.3.1Cursoir pointer (crosshair) is synchronized between several charts in the same group. It has to be enabled in each chart separately.
Hotkey Manager
Available since version 3.2.25Hotkey Manager is available in Preferences. Users can set their own hotkeys for some of the functions.
Show trading object labels
Available since version 3.2.25Trading object labels, e.g. Open position P/L, can be displayed permanently in chart. Look out for the new setting under Preferences/Chart: Hide Trading Object Labels on mouse out
Improved OHLC index
Available since version 3.2.25OHLC index shows information of price based charts.
Cursor pointer for subpanel
Available since version 3.2.22Cursor pointer can be used for Indicators in chart sub panel.

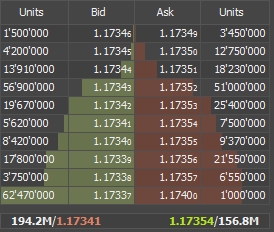
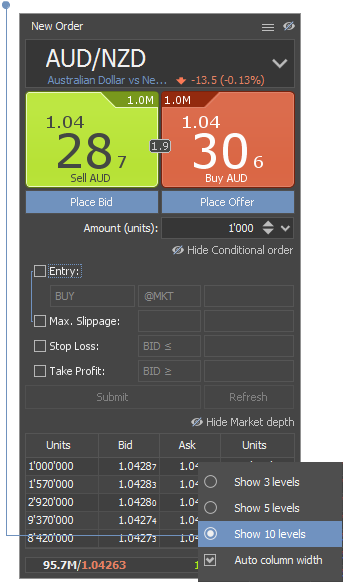
Accumulated sizes in Market depth
Available since version 3.2.21Accumulated size (price multiplied by volume) is shown in Market depth now. It can be disabled in context menu, which can be opened with right click on the Market depth table.
Improved chart trading
Available since version 3.2.21Order placement has been improved. It is possible to change the price and add Stop Loss and Take Profit orders with drag&drop.
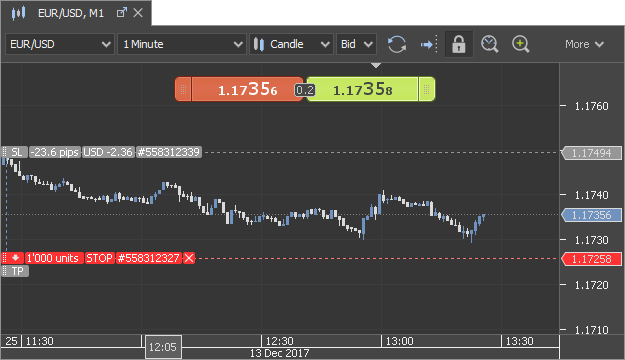
This can be done after line selection with double click or by single click and drag on the label at the left side of the line (with the dots).
Open positions are shown as horizontal lines now. They can be disabled in Chart layer list.
Stop Loss and Take Profit orders can be easily managed:
- drag the label on the left side of the chart away from the entry order or open position's line and drop
- drag and drop again to change the level
- click on the cross to cancel
Information of the estimated result in points and base currency is shown when SL or TP line is highlighted.
Multi-selection of the orders is possible with Ctrl hold while double clicking the lines. Del key can be used to cancel these orders.
Please note that if "One Click" option is enabled, there will be no confirmation dialogs shown.Order price edit from table
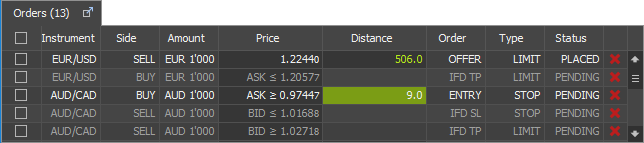
Available since version 3.2.21Order price, Max. Slippage and distance from the current market price can be edited in the Orders table.
Double click the cell to edit or add a value. In order to confirm the new value Enter has to be pressed. In order to disable Max. Slippage - delete the value and press Enter. If Distance value is changed, order price will be adjusted.
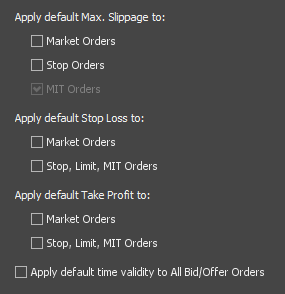
Automatic orders placement
Available since version 3.2.21Stop Loss and Take Profit orders can be placed automatically for each:
- Marker order
- Stop order
- Limit order
- Market if tauched (MIT) order
The distance can be set in Preferences/Instruments.
Market and Stop orders can be placed with default Max.Slippage.
Enable these settings in Preferences/General
Price alerts improvements
Available since version 3.2.21- Alert status can be changed with the toggle button in the table.
- Alerts can be set and price changed with the Distance cell edited. Press Enter to confirm the new value.
- Quick filter can be used to search by instrument.
- Sound can be played once.
- Sound will stop, when pop-up message is closed.
Highlight order distance
Available since version 3.2.21When order or price alert comes close to the current market price, Distance cell can be highlighted with the green or red (for Stop Loss orders) colour background.
In order to enable this feature, please check "Highlight Distance if value is less than 0.1%" in Preferences/General.
Note, that you can choose between calculating the distance in % from price or in spreads between best bid and ask.Point&Figure chart settings
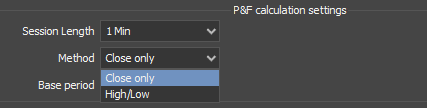
Available since version 3.2.21Point & Figure charts are calculated from the interpolated data no more. Session length and construction method can be chosen instead. Close only and High/Low methods are both available,
Copy/Paste indicators
Available since version 3.2.21Indicators can be copied and pasted into same or other chart:
- using context menu
- holding Ctrl and drag&droping the indicator on the other node in Navigator
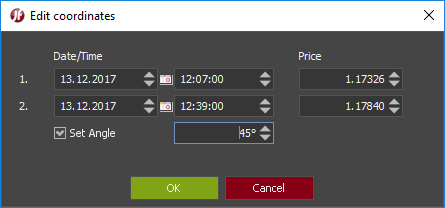
Set angle for drawing objects
Available since version 3.2.21Angle can be set for these objects:
- Short line
- Long line
- Ray line
Angle will be fixed and will not change on chart price scale zoom in/out. Edit the coordinates and enable the angle.
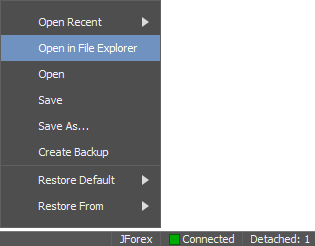
Open workspace in FM
Available since version 3.2.21Workspace can be opened in File Manager. Right click to open the menu on the workspace name in the status bar.
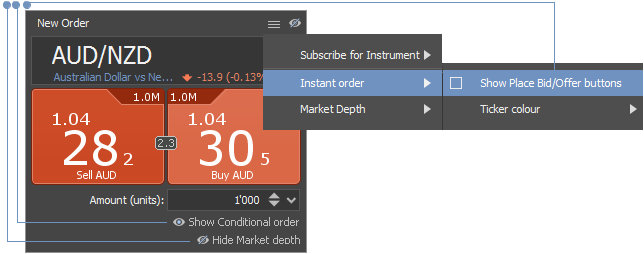
New order chart widget
Available since version 3.2.19New chart widget New order has been added. It can be enabled in chart toolbar.
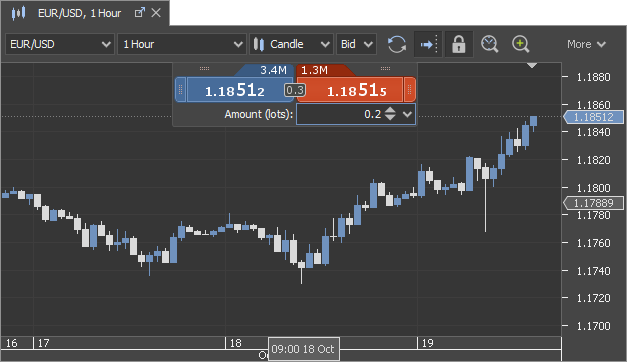
When price buttons, where current Bid and Ask are shown, are hit, orders at market price are sent. Pending orders can be placed with drag and drop using the side buttons. Order type (Stop or Limit) is detected depending on the side and current Bid/Ask.
Order preview will only be shown in case "One click" option is disabled.
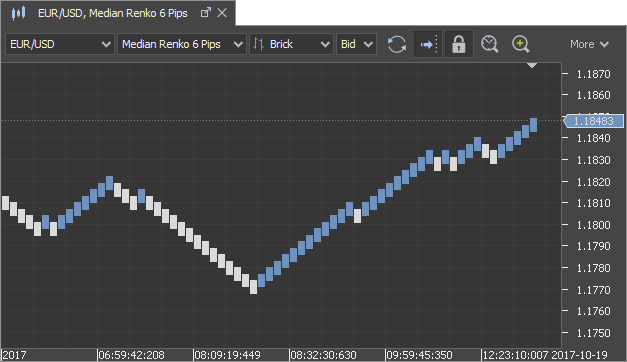
If not, orders will be sent right away. Please use with caution!Median Renko
Available since version 3.2.19Median renko, another type of price based chart, similar to Renko, has been added.
Screen label object
Available since version 3.2.19New chart drawing object "Screen Label" has been added. It's a text label, which has fixed coordinates and does not move when the chart gets scrolled.
Changes in Orders table
Available since version 3.2.19Max.Slippage has been moved to separate column. Trailing step of Stop orders has moved to Type column.
Time based Drawing objects unlinked
Available since version 3.2.19Time based drawing objects:
- Time marker
- Periods
- Candlestick
- Fibo Time zones
- Fibo Time zones %
are not linked to instrument anymore.
Drawing objects linked to instrument
Available since version 3.2.17All drawing objects in the chart get linked to the instrument. If instrument chosen in chart is changed, these drawing objects are not displayed.
The instrument linked to the object is shown in [] brackets in Navigator.
Display coordinates distance
Available since version 3.2.17The distance between the drawing object's coordinates is displayed now. It can be hidden under the settings of each object.
CET as a Day start time
Available since version 3.2.17CET zone has been added among Day start time settings in Preferences/Chart.
Increase price step
Available since version 3.2.17When price spinner is used or order line in chart gets moved with arrows, arrow keys or mouse wheel, the step is 0.1 points.
If Shift is hold, it gets increased to 1 point!
View settings in Market overview
Available since version 3.2.17Max.Slippage and Place Bid/Offer buttons can be hidden in Market overview now. Use "View" section of the menu.
Open Order panel with F9
Available since version 3.2.17Order panel can be opened with F9 key. Select the instrument in different places across the platform (listed below) and press F9 to open the panel.
- New order panel
- Instruments
- Chart
- Positions Summary
- Positions
- Orders
- Market overview
No more than 5 order panels can be opened simultaneously.Improved windows tile
Available since version 3.2.16It is possible to choose how to dock and tile ordered different tables and charts now instead of "Tile ordered", which did it automatically.
Mouse wheel usage in spinners
Available since version 3.2.15Value in spinners can be changed with mouse wheel now. Right click on the arrows up or down to reset the value to default.
Status bar in Positions
Available since version 3.2.15Status bar can be enabled in Positions table, which shows P/L of the selected positions.
Right click on any table column header to open the menu and enable the Status bar.
Price alerts in charts
Available since version 3.2.15Price alerts can be managed from the charts now.
A layer showing them can be enabled or disabled under Chart layers button in chart toolbar. Or use Ctrl+R hot key.
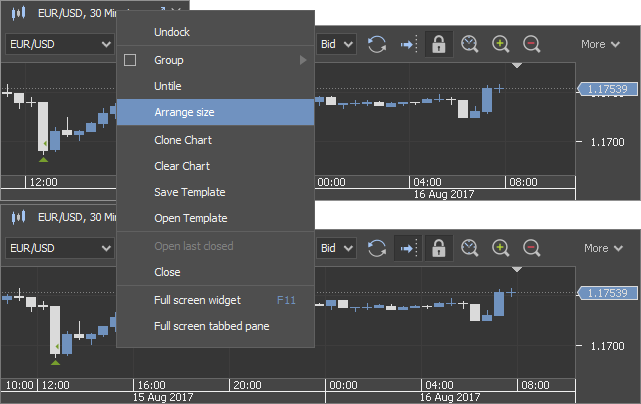
Arrange window size
Available since version 3.2.15Windows docked can be arranged in equal size. No need to set the size manually anymore.
Indicators of shorter periods
Available since version 3.2.15Indicators calculated on shorter periods can be shown in chart of longer periods.
Fibonacci Time Zones %
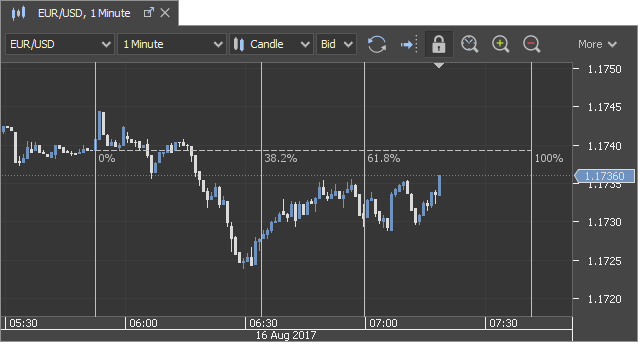
Available since version 3.2.15Fibonacci Time Zones % tool has been added to the chart.
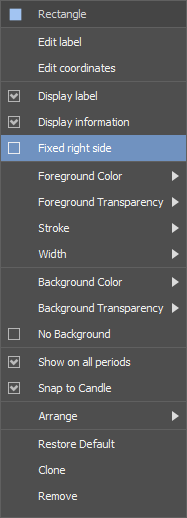
Extended Ractangle
Available since version 3.2.15Rectangle object can be extending its width when a new candle or bar is drawn.
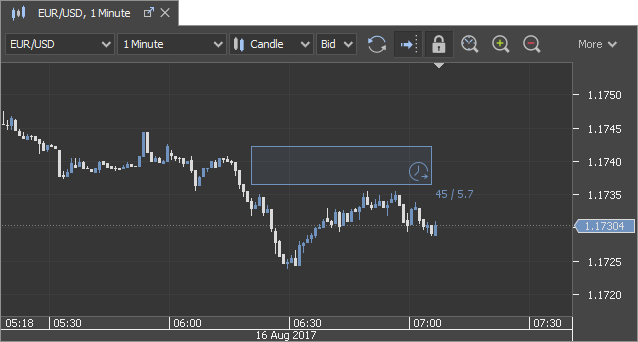
Uncheck Fixed right side to enable it.
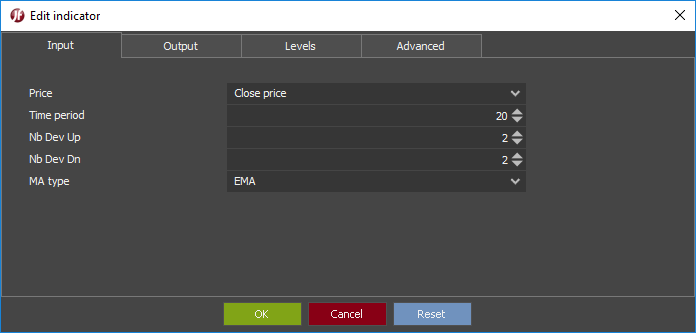
New indicator: PERSBBANDS_EXT
Available since version 3.2.15Indicator PERSBBANDS is limited in its settings. e.g. MA type cannot be changed.
In order to allow changing more of its settings, we have added another one called PERSBBANDS_EXT
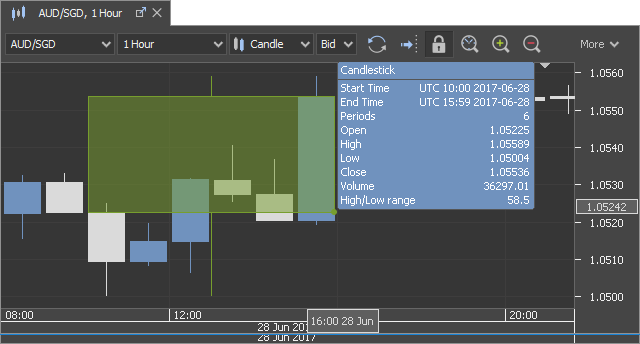
Candlestick tool
Available since version 3.2.13New drawing object has been added in 3.2.13. It draws the candlestick and shows the OHLC prices from the start time to the end time.
Sorting of drawing objects
Available since version 3.2.13Drawing objects can be sorted now similar to Indicators. Use context menu or drag&drop the objects in Navigator to change the order.
GMMA indicator
Available since version 3.2.13Guppy Multiple Moving Average indicator has been added with GMMA abbreviation.
It is a combination of two groups of moving averages with differing time periods.
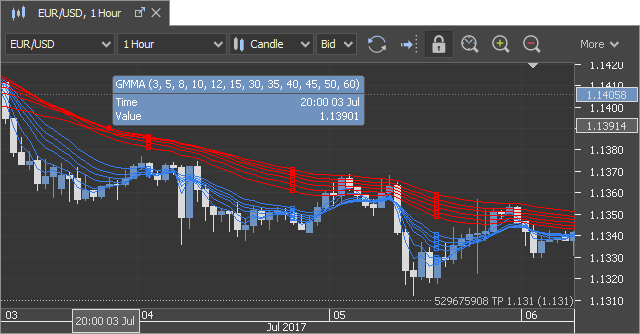
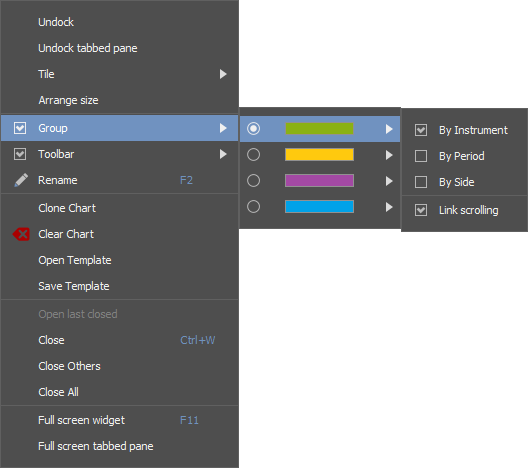
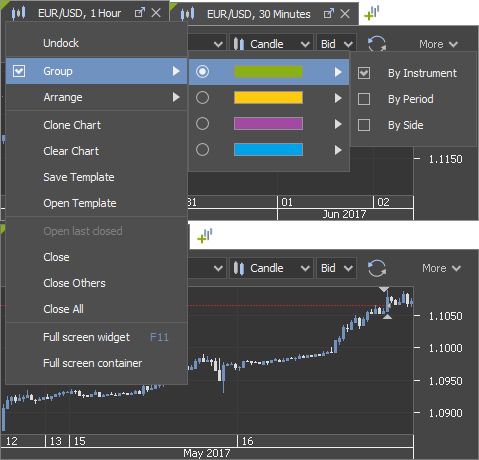
Chart grouping
Available since version 3.2.2Charts can be grouped
- by instrument
- by period
- by side
in 4 different groups now. Right click on the chart tab to enable or disable grouping.
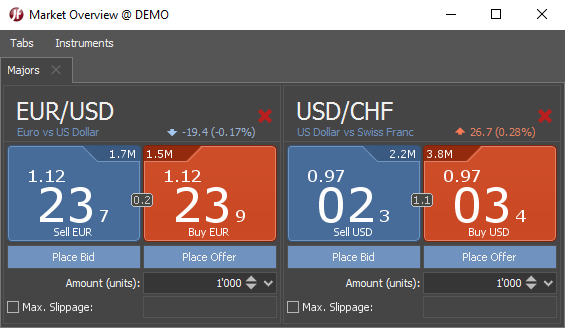
Daily change in Market overview
Available since version 3.2.2Daily change and instrument's description is shown in Market overview.
Sorting of Indicators
Available since version 3.2.2Indicators can be sorted now. Use context menu or drag&drop the indicators in Navigator to change the order.
Account section in main menu
Available since version 3.2.1Account section has been added in main menu.
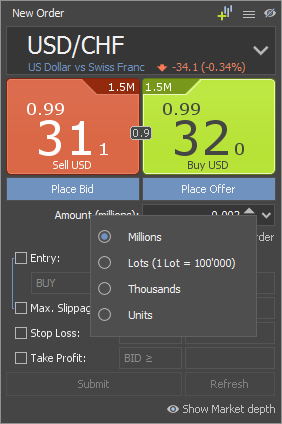
Change amount units
Available since version 3.2.1Amount units can be changed from context menu in New order panel.
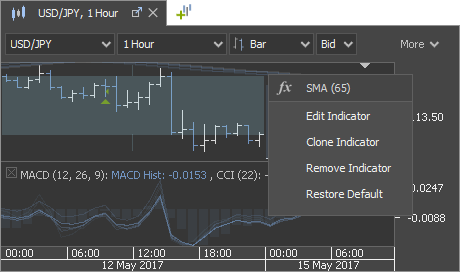
Clone indicator
Available since version 3.2.1Indicator can be cloned in charts . Object's name is shown in context menu.
Levels for Channel lines
Available since version 3.2.1Levels can be added to Channel Lines object in chart.
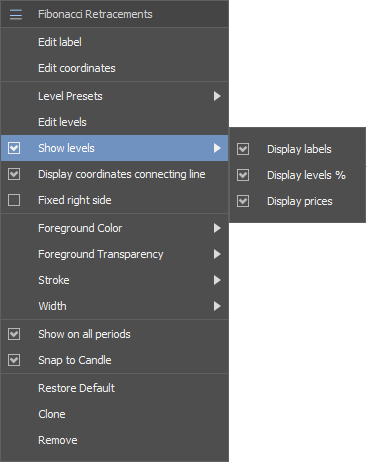
Show Levels of Fibonacci
Available since version 3.2.1Levels of Fibonacci tools can be customized now.
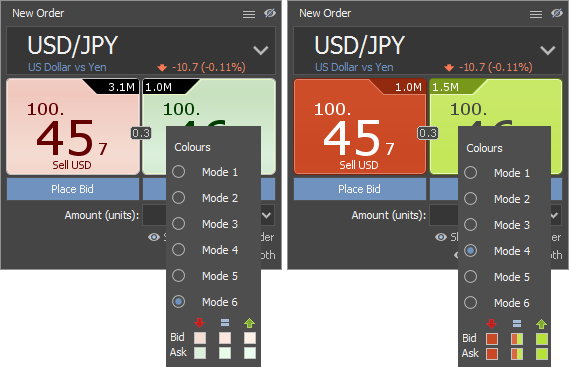
New colours for market direction
Available since version 3.2.1New colours have been added for market price direction in New order panel and chart themes.
"New chart" button
Available since version 3.2.1"New chart" button has been added in chart area next to the chart tabs.
Horizontal Ray line
Available since version 3.2.1Ray line can be drawn horizontally in charts with Shift hold. Same as Short line.
Open chart from New order panel
Available since version 3.1.9A new button has been added in New order panel, which opens the chart of the instrument chosen.
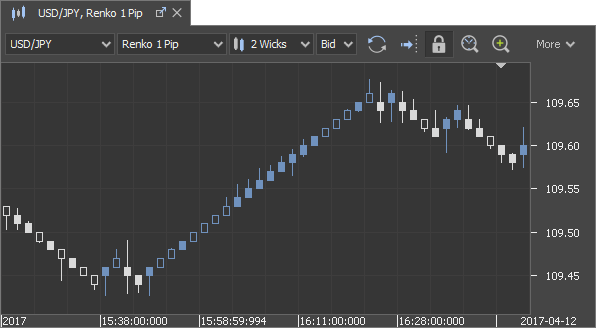
2 wicks for Renko
Available since version 3.1.9Besides the usual wicks for Renko charts, which are drawn in one direction only, the opposite wicks can be shown as well now. This is useful for low and high detection, when Renko are calculated on longer sessions, e.g. 1 hour.
Null bricks, which are bricks with 0 volume, can be shown transparent now. This feature is enabled by default and can be disabled in Preferences/Chart/Show transparent body for Null Renko bricks and Price Range candles.
Drawing object snapping
Available since version 3.1.9Drawing object snapping has been improved. The circle indicates that the snapping is used. It can be disabled in the context menu of each object.

Fullscreen
Available since version 3.1.9Tables and charts can be full-screened now individually. Focus has to be set on them before F11 pressing (Control-Command-F for OS X).
Improvements in Navigator
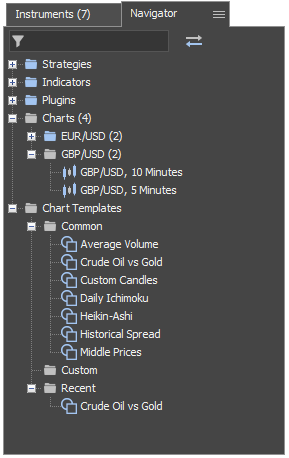
Available since version 3.1.9- The total number of charts opened are show in brackets now.
- Chart Templates are shown in Navigator as well now. There are several templates added in "Common" section. They can be opened by Drag&Drop on the chart area or from the context menu.
- New toggle button "Link with other panels" has been added next to the filter. If disabled, nodes do not get expanded and items selected, when the objects get selected in Charts, Code Editor and Strategies panel.
Mute sound
Available since version 3.1.9The sounds can be muted in the right top corner, near the clock, now.
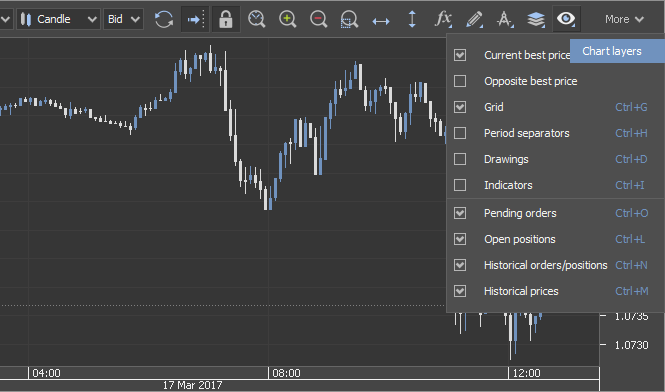
New Chart Layer: Tooltips
Available since version 3.1.8New chart layer toggle button, which shows or hides all kind of tooltips has been added under "Chart layers" in chart toolbar.
Chart Layer toggle buttons
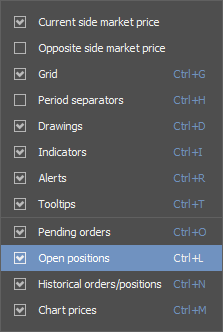
Available since version 3.1.7It is possible to show/hide different layers in the chart on individual level now.
- Current Best price - shows the best price line of the bid or ask, which is set in the chart settings
- Opposite Best price - shows the best price line of the opposite side. e.g. if bid is set in chart, opposite side line will be ask
- Drawings - shows all the drawing objects. If this level is disabled, but new object is added, the layer gets enabled automatically
- Indicators - shows all the indicators on the chart. If this level is disabled, but new indicator is added, the layer gets enabled automatically
- Historical prices - shows the historical prices on the chart. It is useful to hide it in case some indicators are drawn, which substitute this data. e.g. HEIKINASHI, CUSTOMCANDLE or MIDDLE_PRICES.
Time in Positions table
Available since version 3.1.7There is a new column available in Positions table named Time, which shows the creation time of the position.
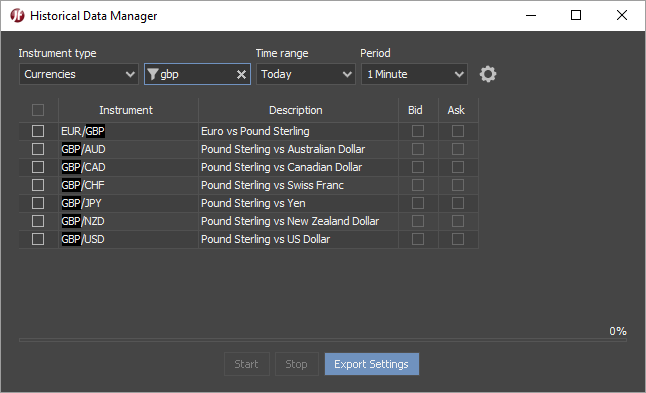
New UI for HDM
Available since version 3.1.6User interface for Historical Data Manager has been changed and made more simple. Many settings like Flats filter, Day Start Time zone, Platform time zone and Price based period calculation settings are taken from Preferences.
Workspace path
Available since version 3.1.6Workspace path has been moved to Preferences/Workspace
Logs path
Available since version 3.1.6Logs path is available in Preferences/Advanced/Path
Gann Angle and Gann Periods
Available since version 3.1.5Gann Angle and Gann Periods tools have been improved.
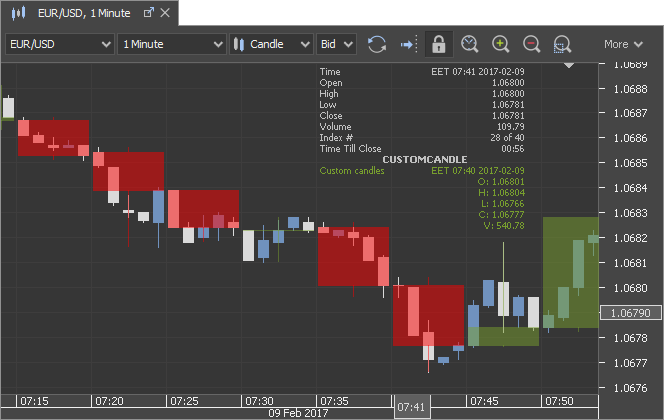
Indicator update: CUSTOMCANDLE
Available since version 3.1.2CUSTOMCANDLE indicator is displayed in OHLC index now. Period can be changed in Advanced settings under "Calculate from custom data"
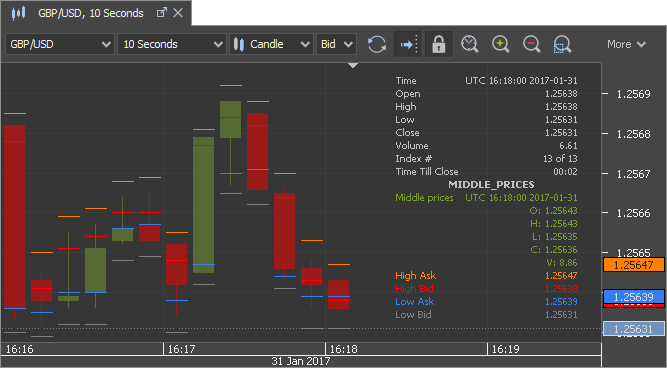
New indicator: Middle Prices
Available since version 3.0.18New indicator MIDDLE_PRICES is available. It shows the middle price between the highs on ask and bid and lows on ask and bid. It gets calculated from ticks.
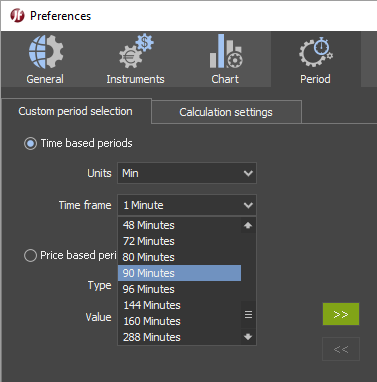
More custom time periods
Available since version 3.0.18There are several custom time periods added by users request.
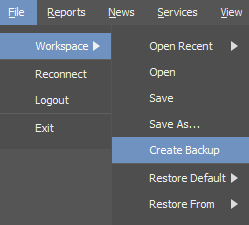
Create Workspace backups
Available since version 3.0.18Workspace backups can be created by request from menu. They get also created automatically on each platform's new version open.
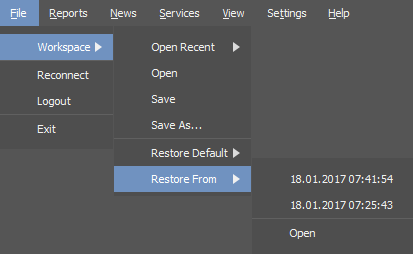
Workspace backups by date
Available since version 3.0.17Workspace backups are shown by their date of creation in menu.
More custom price based periods
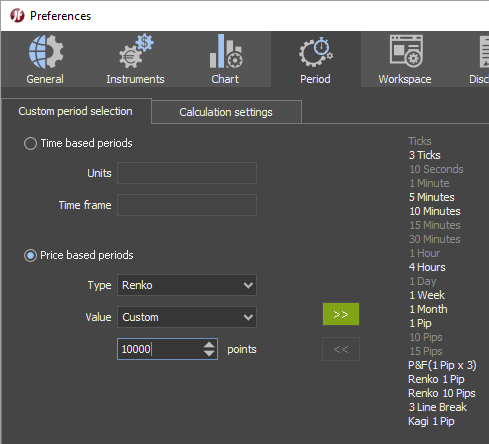
Available since version 3.0.17Price based chart periods can be set up to 10'000 points now.
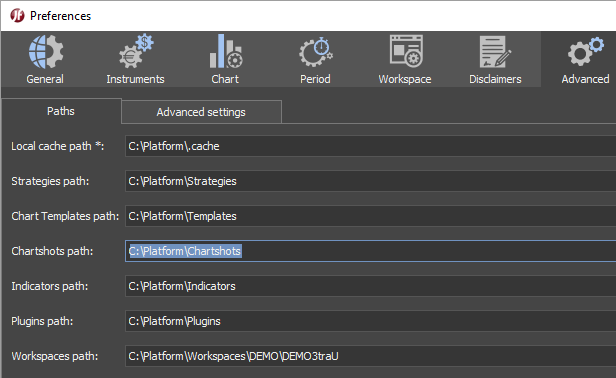
Save path for Chartshots
Available since version 3.0.17Path for Chartshots can be defined in Advanced settings now. Also, this path gets changed and saved if user selects different folder when saving Chartshot. Similar logic gets applied for Workspace, Chart templates, Indicators, Strategies and Plugins when they get opened or saved.
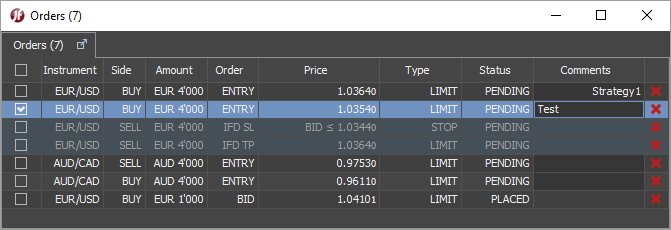
Order comments
Available since version 3.0.16We have added a new column Comments in Orders and Positions tables. Comments can be edited from Orders table for all orders except Place Bid and Place Offer.
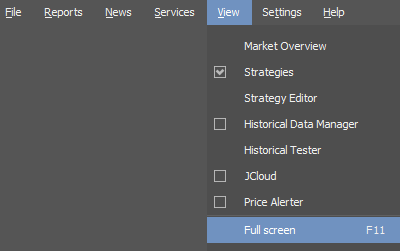
Full screen
Available since version 3.0.16Each window can be full screened with F11 key press now.
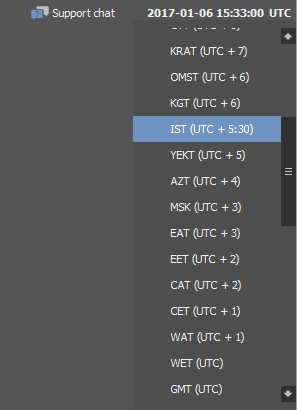
New time zone UTC +5:30
Available since version 3.0.16We have added new time zone: India Standart Time UTC + 5:30
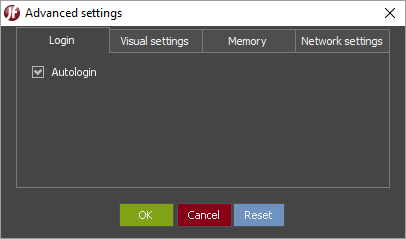
Autologin
Available since version 3.0.15It has become possible to autologin if Remember me option is enabled and Autologin is switched on under Advanced settings in Login window.
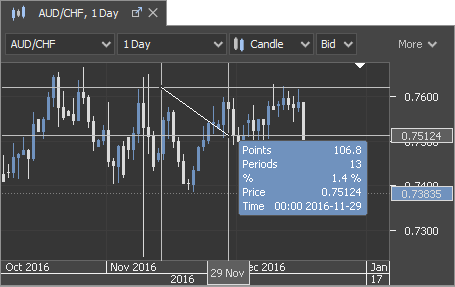
Cursor pointer values
Available since version 3.0.15It has become easier to read Cursor pointer values now.
Time zone change
Available since version 3.0.14Platform's time zone can be set by right click on the time in right top corner of the platform.
Preferences in OS X
Available since version 3.0.14Preferences and About menu sections have been moved to the main menu for OS X users.
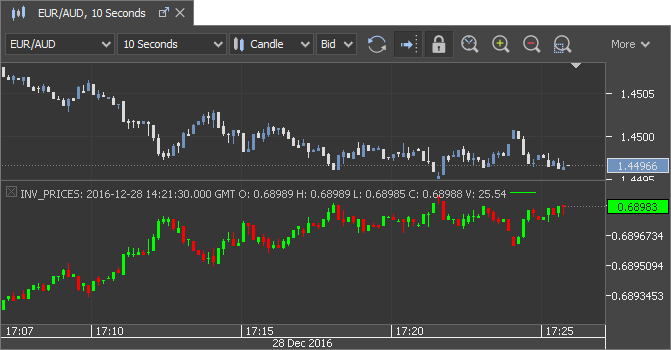
New indicator: Inverted prices
Available since version 3.0.14INV_PRICES indicator is available in 3.0.14, which mirrors the historical prices.
Tracking line customization
Available since version 3.0.14Indicator's values tracking lines can differ from Last price tracking line in 3.0.14. It can be customized under chart theme Misc section.
Orders distance
Available since version 3.0.13There is a new column available in Order table: Distance
It shows the distance between the pending order price and current market price.
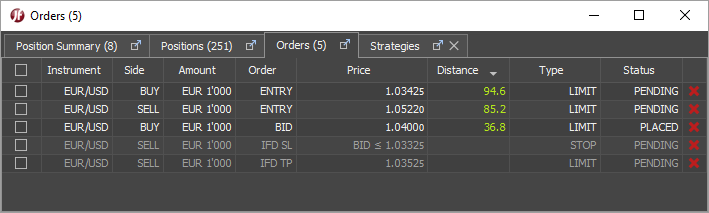
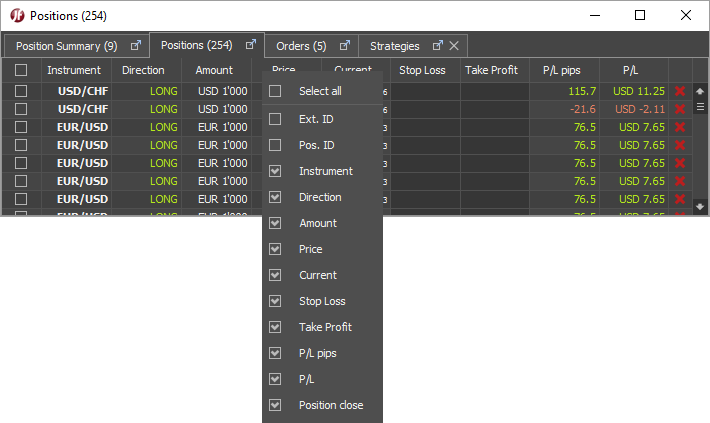
Table column customization
Available since version 3.0.13Column customization is available in the following tables:
- Position Summary
- Positions
- Orders
- Strategies
In order to select/deselect the columns to display, right mouse click any column header.
Snap to Candle
Available since version 3.0.11There used to be 2 separate settings for drawing objects snap to OHLC prices and time values in Preferences/Chart. We have removed them from global level and Snap to Candle/Bar price has been renamed to Snap to Candle under individual level of each object.
When changed, it gets saved for that object and applied on every new object drawn on chart.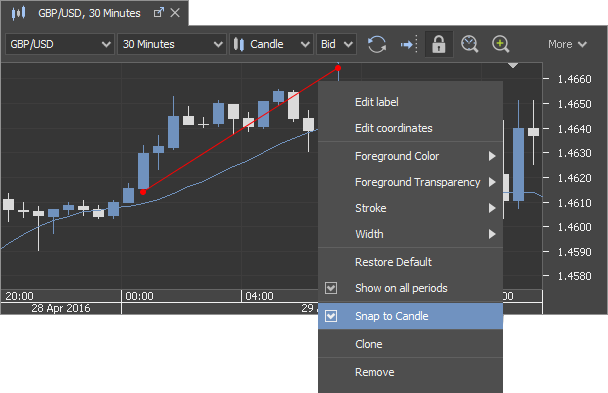
Multi-select in Navigator
Available since version 3.0.10There can be several nodes selected in Navigator since version 3.0.10
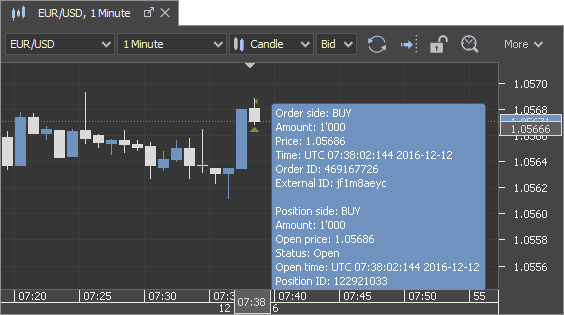
Historical orders info
Available since version 3.0.9We used to show historical order labels in chart, which showed External ID and P/L and could be enabled/disabled in Preferences. In case of many order on the chart this approach was inconvenient and made the information almost unreadable.
In order to solve this, we show the tooltips instead now with a lot more information available.
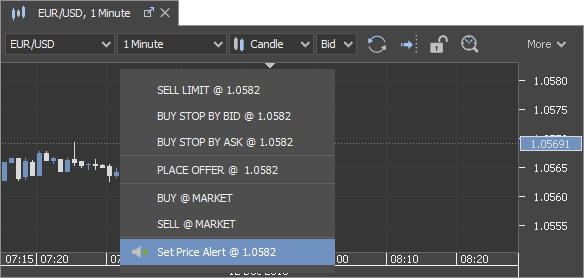
Set price alerts from chart
Available since version 3.0.7Price alerts can be set from the chart since version 3.0.7
Colour themes
Available since version 3.0.5There are 2 colour themes available under main menu Settings:
- Light (Default)
- Dark
Zoom in/out
Available since version 3.0.5Every object's size can be increased, which is useful for those who use monitors of higher resolution than Full HD.
There are 2 ways to do it:
- from menu: Settings/Zoom/
- Ctrl + mouse wheel scroll
Workspace: Restore
Available since version 3.0.5There are 2 versions of built-in workspace available:
- JForex
- Standard
User can always restore the settings and layout from the menu:
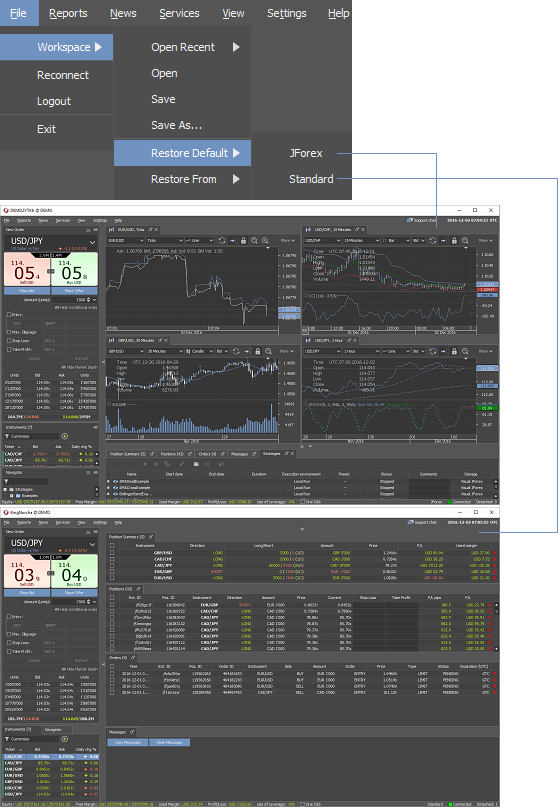
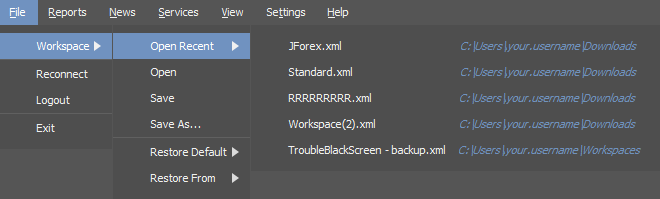
There used to be "Standard" as a separate mode. It has been changed to a built-in workspace nowWorkspace: Recent list
Available since version 3.0.5A list of 5 recently opened workspaces has been added to main menu:
Workspace: Restore from backup
Available since version 3.0.5User can open the automatically generated workspace backup files in case there is something lost in the user's workspace after new platform version launch:
Backup files are generated for each workspace on new platform version launch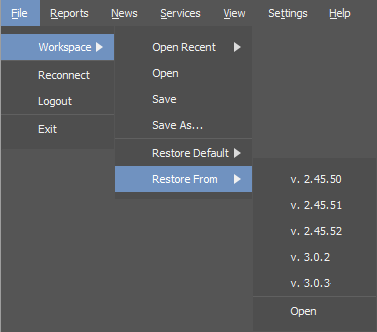
Spread
Available since version 3.0.5Best Bid/Ask spread is shown between best bid/ask buttons.
Daily price change
Available since version 3.0.5Current day change in points and as %
Please note that "Daily change" result depend on the time zone set in "Preferences"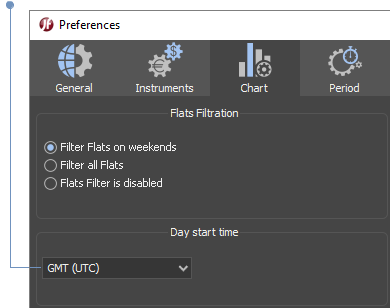
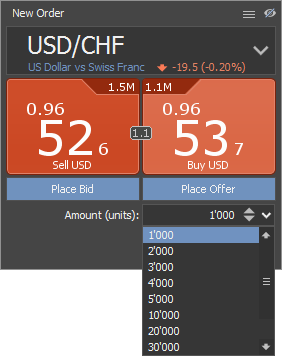
Amount spinner
Available since version 3.0.5- Click on the arrow up/down to spin
- Click on the arrow to open the list of predefined amounts. Amounts cannot be customized.
Show/hide
Available since version 3.0.5Place Bid/Offer buttons, Conditional order and Market depth panels can be hidden
Amount of the Market depth table rows can be changed
Price button colours
Available since version 3.0.5There are 6 colour modes available
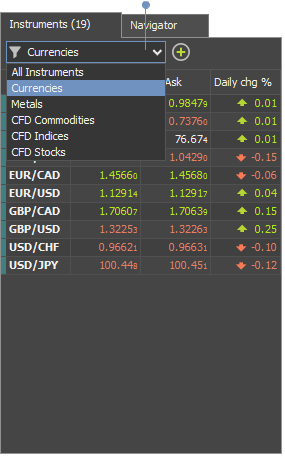
Instruments filters
Available since version 3.0.5Instruments type is shown in different colours
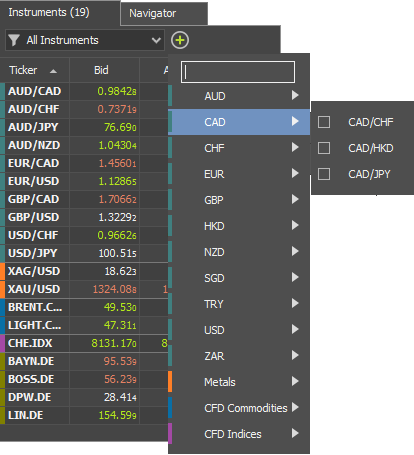
Click on the arrow to filter by type
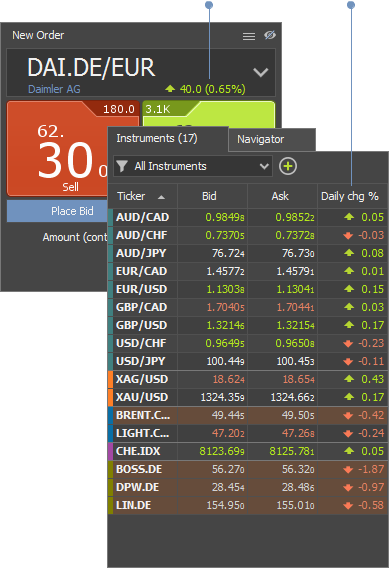
Search and filter by symbol
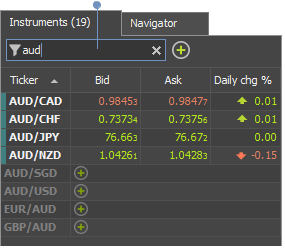
Instruments search
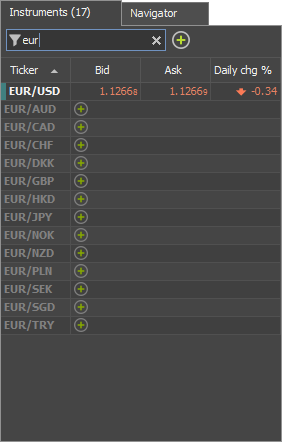
Available since version 3.0.5Search by name or symbol inside New order panel or Charts. Search is made from all the instruments allowed.
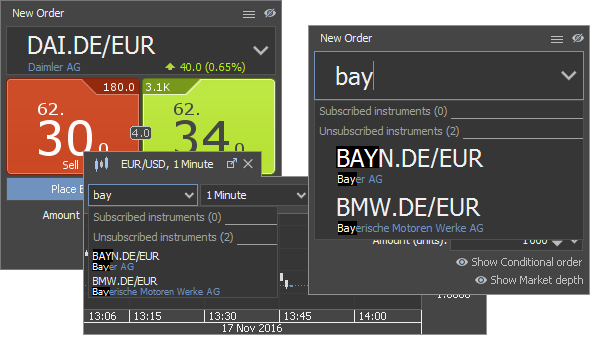
Search by symbol inside Instruments panel. It works as a filter at the same time, so it is not possible to search by name here.
Instruments subscription
Available since version 3.0.5In order to receive a price feed of some instrument, it needs to be subscribed. It is possible in New order panel as well now.
- Click on unsubscribed instrument to subscribe and select
- Hold Ctrl while clicking to subscribe for several instruments
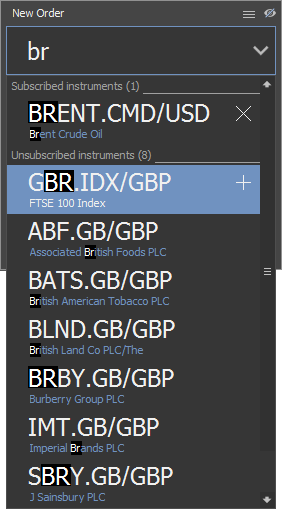
- Hold Ctrl and click on cross to unsubscribe
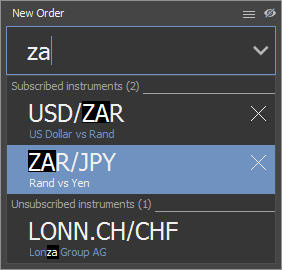
- Clik on + to subscribe in Instruments panel when filter is enabled
- Click on Subscribe button to subscribe from menu
Please note: the more instruments are subscribed, the more data are incoming and need to be processed. This can result in slower order request processing.Instruments selecting and sorting
Available since version 3.0.5Rows in Instruments table can be single and multi selected.
- Left click to single select:
- Multi-select by holding Ctrl or Shift or mouse drag over several rows
- Select and drag within the table to custom sort
Click on column header to return to column sorting or use context menu:
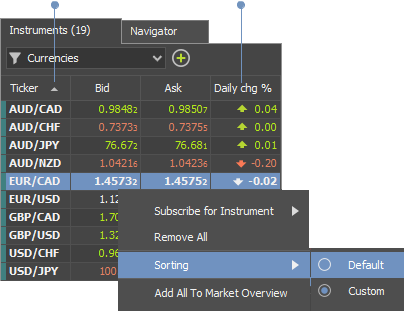
Chart: Open
Available since version 3.0.5- Single or multi-select instruments
and drag on the free space in chart area to open charts
- Drag on the existing chart to change the instrument
- Hold the Ctrl and drag on the existing chart to overlay the instrument
Chart: Custom periods
Available since version 3.0.5Add more opens Periods section in Preferences where more custom time periods can be added.
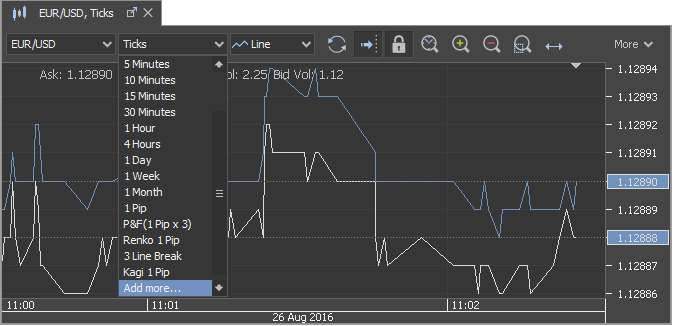
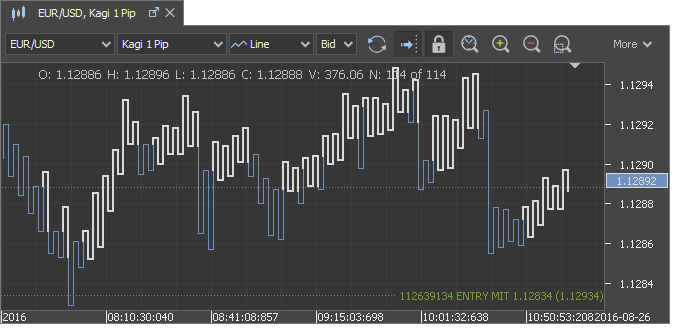
Chart: KAGI
Available since version 3.0.5KAGI charts are available now
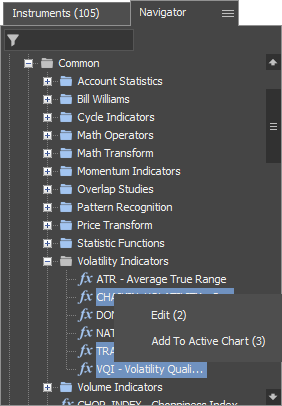
Indicators: Built-in indicators
Available since version 3.0.5Besides Add indicator dialogue, built-in indicators are available in the Navigator panel now as well.
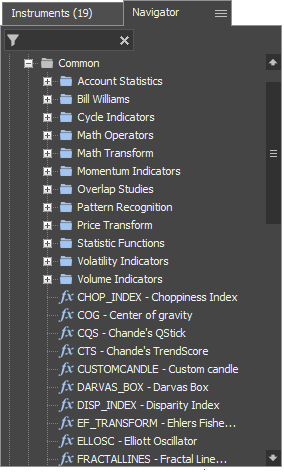
List of the recently used indicators is available in Navigator as well
More than 30 new built-in indicators have been added:
- Chaikin's Volatility
- Bollinger Bands - Fibonacci Ratios
- Bollinger Bandwidth
- Chande's Dynamic Momentum Index
- Chande's QStick
- Chande's TrendScore
- Chande's Variable Index Dynamic Average (VIDYA)
- Choppiness Index
- Currency Slope Strength
- Darvas Box
- Disparity index
- Ehlers Fisher Transform
- Ehlers Laguerre Relative Strength Index
- Elliott Oscillator
- Gann HiLo Activator
- Gann Swing Oscillator
- Gann Trend Oscillator
- Inertia
- Kaufman’s Efficiency Ratio
- Mass Index
- Keltner ATR Bands
- Kurtosis
- McClellan Oscillator
- McClellan Histogram
- McClellan Summation Index
- Rainbow charts
- Rainbow oscillator
- R-Squared
- Schaff Trend Cycle
- Stoller Average Range Channels
- Trend Continuation Factor
- Trend Intensity Index
- Trend Oscillator
- Trend Trigger Factor
- True Strength Index
- Volatility Quality Index
There are around 300 built-in indicators in total and source code is available for most of them.Indicators: Add indicator on chart
Available since version 3.0.5It is possible to search for the indicator among Common (built-in), Custom or Recent nodes in Navigator panel and drag&drop it on the chart.
There are some indicators, e.g. "Simple Moving Average (SMA)", which can be added to the main chart area as well as sub-panel.Indicators: One Indicator on another
Available since version 3.0.5Indicator can be calculated on the output of the other indicator. In the sample provided below SMA is calculated on the Volume:
Indicators: New indicator drawing style
Available since version 3.0.5Histogram has been added as a new style for sub-panel indicators
Indicators: Custom data
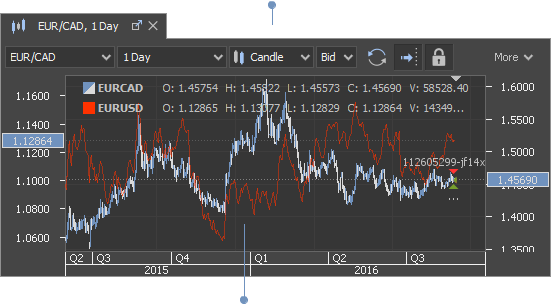
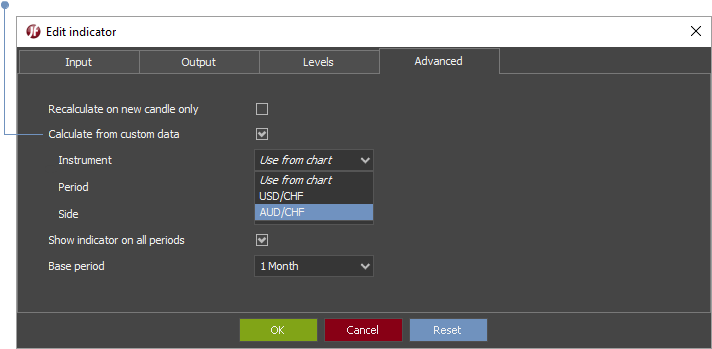
Available since version 3.0.5Indicator drawn on e.g. EURUSD can be calculated on different:
- Instrument (it needs to be added on the same chart as overlaid first)
- Period (list defined under Preferences)
- Side (Bid or Ask)
Indicators: Show/hide
Available since version 3.0.5Indicator drawn on the chart can be shown on one or several periods, but hidden on the others. User must uncheck this checkbox to customize it.
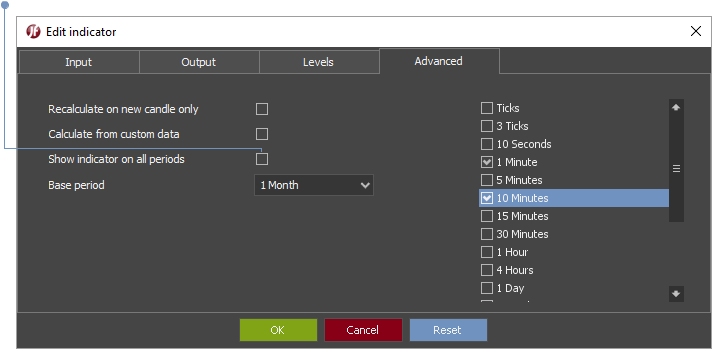
Indicators: Base period
Available since version 3.0.5Values of some indicators, e.g. RSI, depend on the starting point in time. In order to avoid loading all the available price history, we have added Base period in advanced settings, which determines the starting point. We set its value depending on the chart period chosen, but user can disable it.

Complete list of the indicators with base period is available here.
Disabling Base period can lead to previous indicator's values change, when the new candle is drawn, as there is a certain amount of data in chart's buffer. Stop limit level
Available since version 3.0.5We are showing the stop limit price level now if Maximum slippage for Stop or MIT (Market If Touched) orders is set. Max Slippage is mandatory for MIT orders.
SL/TP edit from table
Available since version 3.0.5Stop Loss or Take Profit can be quickly placed/changed by left double click in the Positions table and Enter pressed for confirmation. Value needs to be deleted and Enter pressed to cancel the order.
All the editable table cells are marked with different background colour.
Used margin
Available since version 3.0.5Necessary amount of money for holding a position (used margin) is shown for each instrument in Position summary now.
This is useful as leverage for each instrument can be different.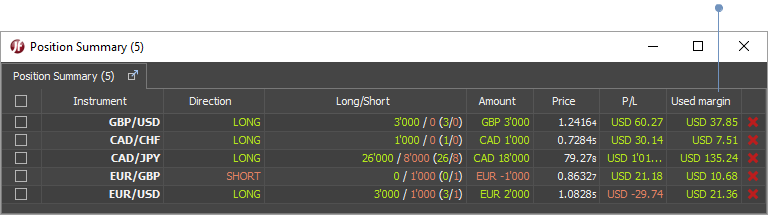
Trading notifications
Available since version 3.0.5Each trading activity is shown as a notification, unless user disables it.
Notifications disappear after 8 seconds if there is a focus on the main window of the platform. They don’t if there is no focus.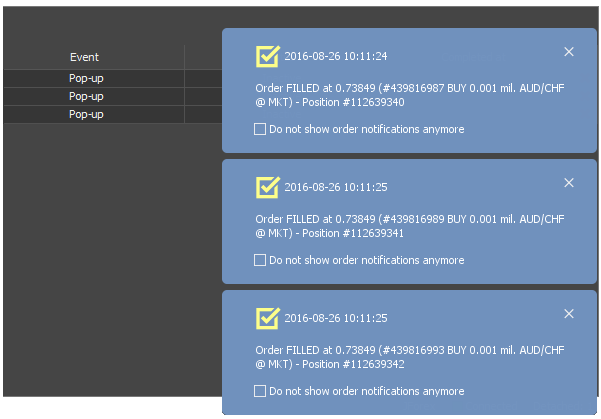
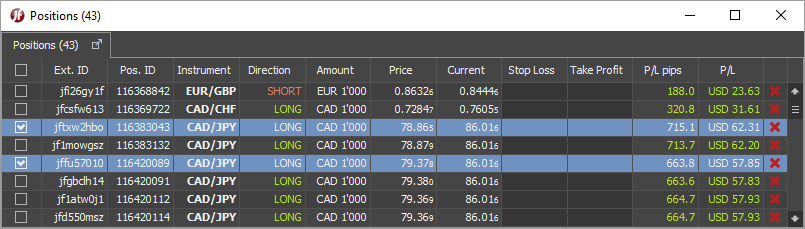
Selection in tables
Available since version 3.0.5Rows can be multi-selected by using:
- Checkbox
- Ctrl + left click
- Shift + left click
- Ctrl + A to select all rows
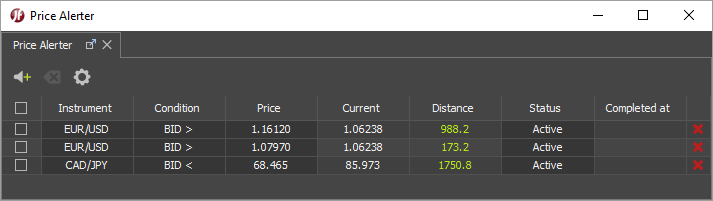
Price alerter
Available since version 3.0.5Price alerter has been improved:
- Toolbar added
- Distance to the current market price added
- Sorting added
- Built-in sounds added
- Possibility so set custom sound