Charts
Objects
Users of the previous generation Desktop platform used to save chart objects like drawings, retracement tools, patterns and the list of the used indicators, in each chart separately. This was inconvenient if several charts were used and the objects had to be edited. Each of the object had to be treated manually.
We have solved this issue in the new version (version 4.2.0 or later), where the user can choose between saving the objects separately or in our JCloud service.
A special toggle button is added in the chart toolbar with 2 objects saving modes available:
 Local mode
 JCloud mode
The toggle button is available in the OBJECTS MANAGER as well.
Objects manager can be enabled with this button:

Local mode
If you want each chart to contain its own objects - drawings, retracement tools, patters and indicators - disable the Jcloud synchronication mode in chart toolbar. The objects will be saved in workspace .jfw file then, which might become large if you use many charts with many objects.
Note that if the chart of the local mode gets closed, the objects will be lost.JCloud mode
If you choose to synchronize the chart objects with our cloud service JCloud, the objects get synced across all the charts within the same platform or other instances. You may even use the same objects in several DEMO and LIVE trading accounts. They need to be linked to the same JCloud account to achieve it.
Everything you draw on the chart can be uploaded to JCloud, if the JCloud synchronization mode is ON:
- drawings
- retracement tools
- patterns
- the list of the used indicators and their settings
Drawings are linked to the instrument they were drawn on by default. However, since there might be a need to draw time based objects (e.g. Time marker) on several charts of different instruments, it is possible to group such objects in a folder, and enable Show for all instruments.
The objects can be shown on the group of charts (by color group) as well.
Indicators are NOT linked to instrument by default. However, since there might be a need to use different indicators with different settings, it is possible to group them in a folder, which is linked to a specific instrument or group of the charts (by color group).
Switching between the modes
In case you want to switch from the Local mode to JCloud mode, you will be asked to decide what to do with the objects the chart contains.
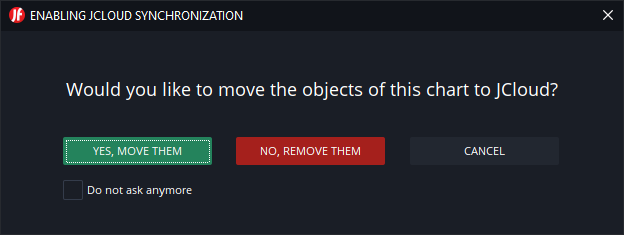
The objects can be moved to the JCloud or removed completely.
In case the IDs of the objects coincide with the existing objects in JCloud, objects will be overwritten.Similar dialog is shown when JCloud mode is being disabled. In this case the objects can be copied.
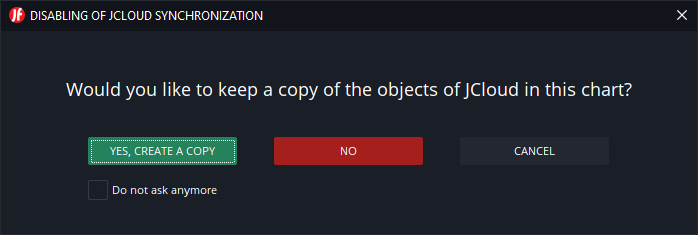
It is not possible to use both - local and JCloud objects in one and the same chart simultaneously.It is possible to save the answer and not show these dialogs anymore. Check "Do not ask anymore" and click on the answer chosen.
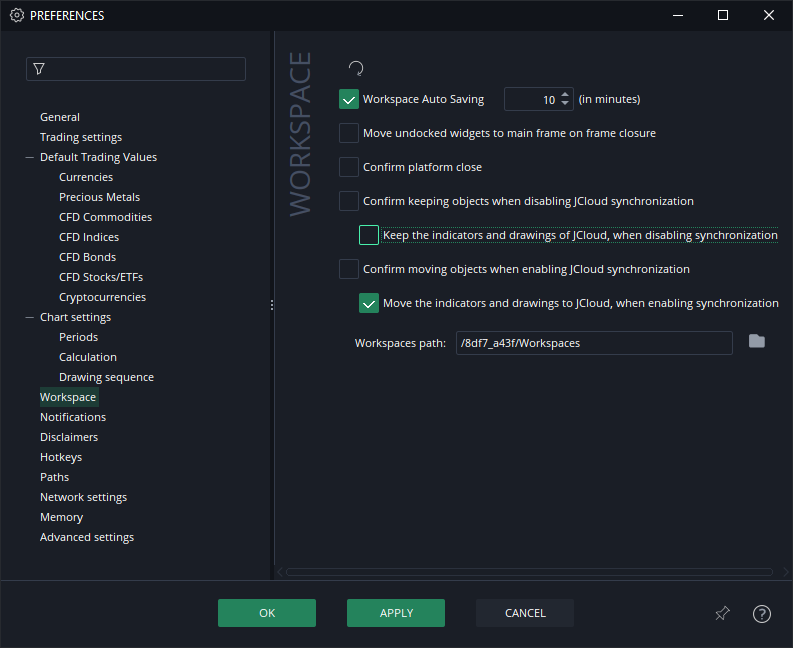
The settings can be found in Preferences, Workspace section.
Objects manager
The chart objects, which are displayed in chart are also shown in OBJECTS MANAGER, which can be enabled in the chart toolbar.
It shows:
- Indicators
- Drawings
- Retracement tools
- Patterns
- Alerts
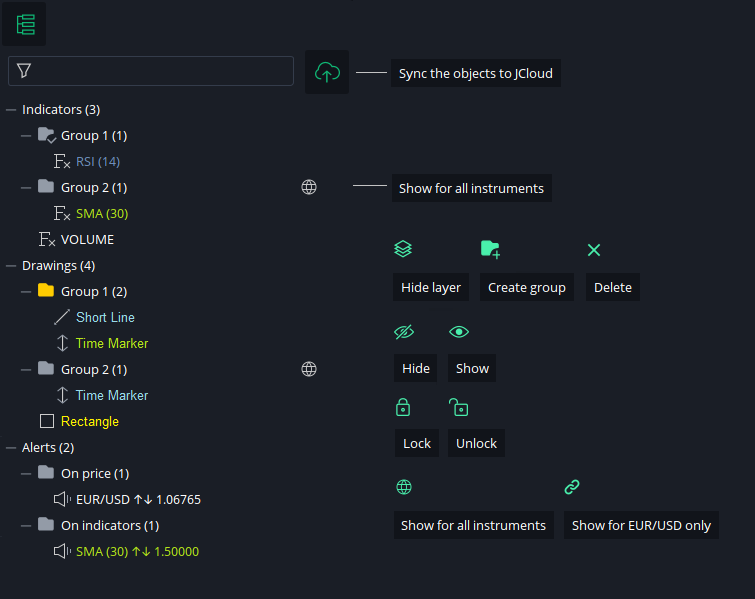
Objects, which are linked to another instrument or another chart group (by color), are not displayed in manager.Indicators
One and the same indicators are usually used on different charts. That's why we did not link them to instrument by default. However, if the output settings of the indicators are instrument specific, it is possible to group them in a separate folder and set Show for this instrument only. In this case, the indicator will be displayed only on the charts of that instrument.
In addition, user can choose which indicators to show or hide in every chart. This feature allows to create a layout with several charts of one and the same instrument, but different combination of indicators.
The last VISIBILITY state is saved on server for each indicator. Thus, when adding a new chart, the indicator keeps the last used visibility state. If the chart is cloned, the states from the parent chart are kept.
If you want to display the indicator in one chart only, it is better to disable the synchronization to JCloud completely.
Drawings
Taking into account that each instrument has different price, the objects, which are price dependent, are meaningless on any other instrument. That is why the objects like drawings, retracement tools and patterns, are linked by default to an instrument they were drawn onto.
However, there might be a need to display time dependent (e.g. Time marker) objects on every instrument. This can be achieved if such objects are grouped into one folder and the settings of the folder are changed to Show for all instruments.
Alerts
Price alerts are saved and managed on server side no matter what mode is enabled. One and the same list of price alerts is synchronized between all our platforms,
In addition, the Desktop platform can monitor the alerts on indicators. These type of alerts depend on the chart and the indicators added to the chart. They can be triggered only on the platform side. If the chart or indicator settings get changed, the alert settings change as well.
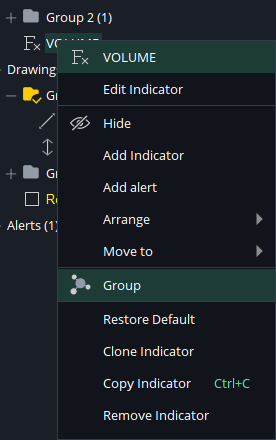
Grouping
Indicators and drawings can be grouped into folders.
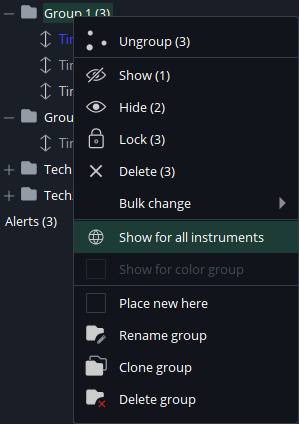
This enables several features:
- All objects in the group can be hidden/shown
- All objects in the group can be locked/unlocked
- All objects in the group can be cloned
- All objects in the group can be shown in all charts
- All objects in the group can be linked to one instrument and shown in charts of that instrument only
- All objects in the group can be shown in charts of a specific color group
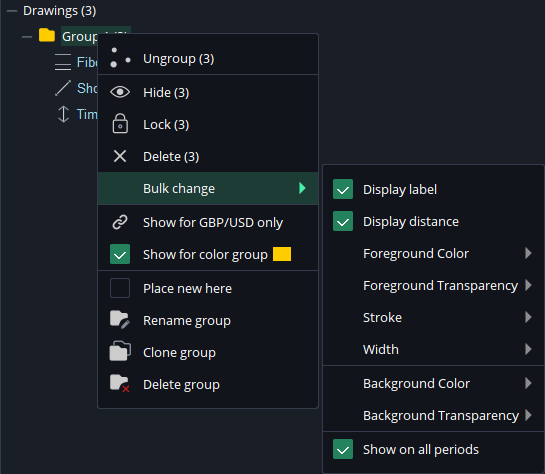
- Some settings, e.g. color, of all the objects in the group can be changed in one step (Bulk change)
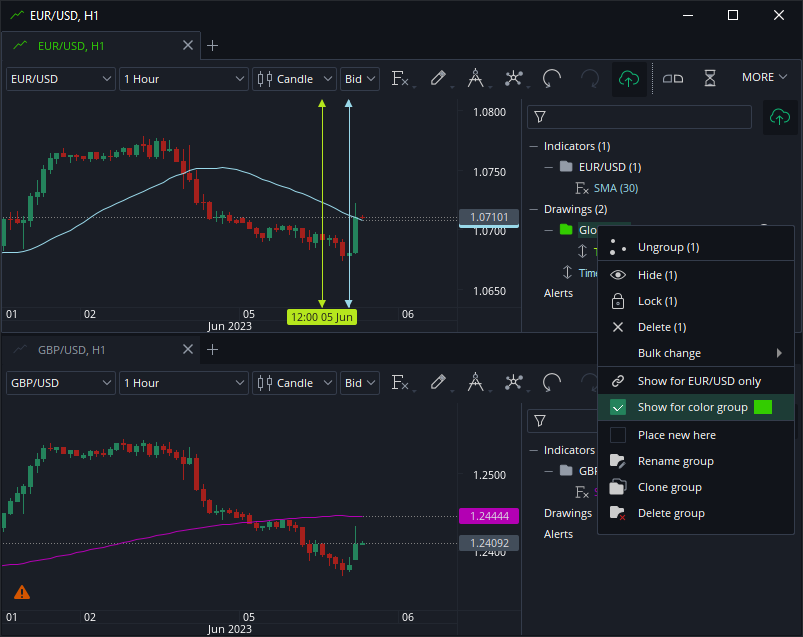
Grouping by color
The objects - indicators and drawings - can be displayed on a specific group of charts marked by color.
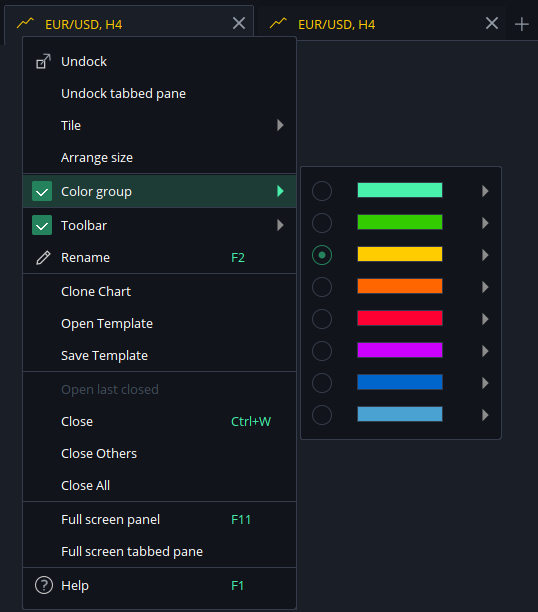
In order to achieve this, group the objects into one folder and enable this setting:
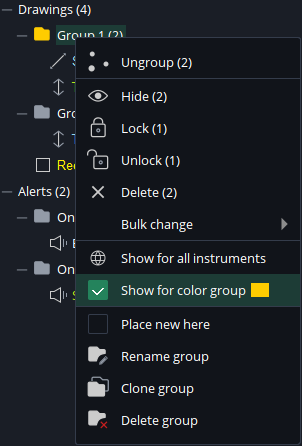
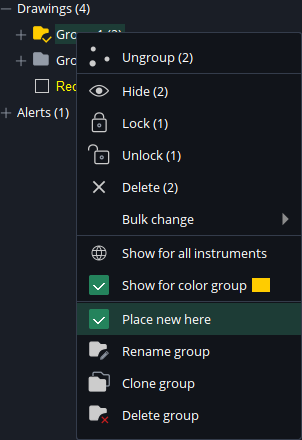
Objects, which are linked to another instrument or another chart group (by color), are not displayed in manager.Place new here
A group or folder of the objects can be set as default. New objects drawn on the chart will be placed in this group.
Object removal
Please note that objects in Local mode are saved in workspace .jfw file and cannot be restored, if the chart is closed.
Consider creating backup files of the workspace, which can easily be done from the main menu: File/Workspace/Create backup. They can be opened from the same menu, when needed.In case this is done accidentally, you can right click any chart tab and select "Open last closed". If you close more than one chart, only the last one can be restored.
In case the objects are removed accidentally in OBJECTS MANAGER, use UNDO function in chart toolbar or CTRL+Z key combination.
Bulk change
Bulk change is a feature, which helps changing some of the settings of the drawing objects in one step. The objects must be grouped to do this.
Grouping examples
Default settings
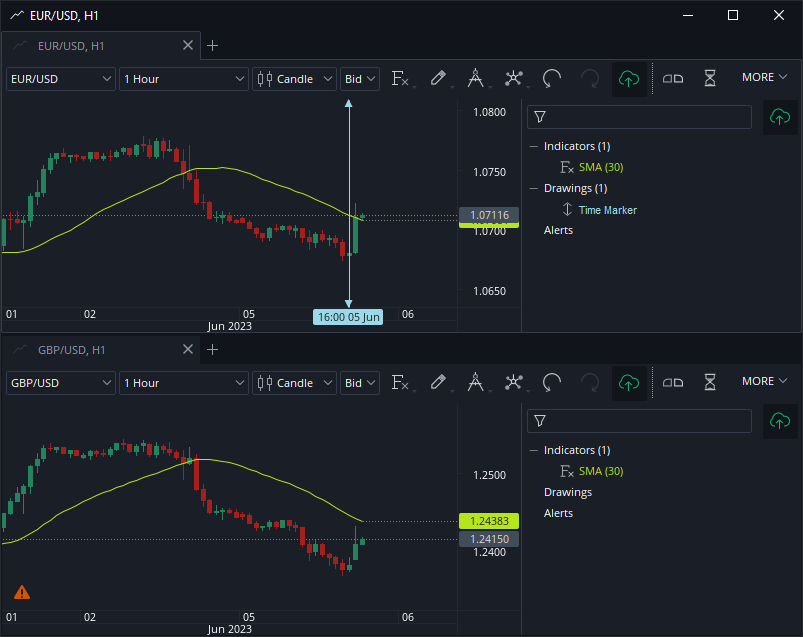
Below is an example showing an indicator and a drawing object with default settings.
- SMA Indicator is not linked to an instrument, so it is displayed in both charts.
- Blue Time marker is linked to EUR/USD by default, so it is not displayed in GBP/USD chart.
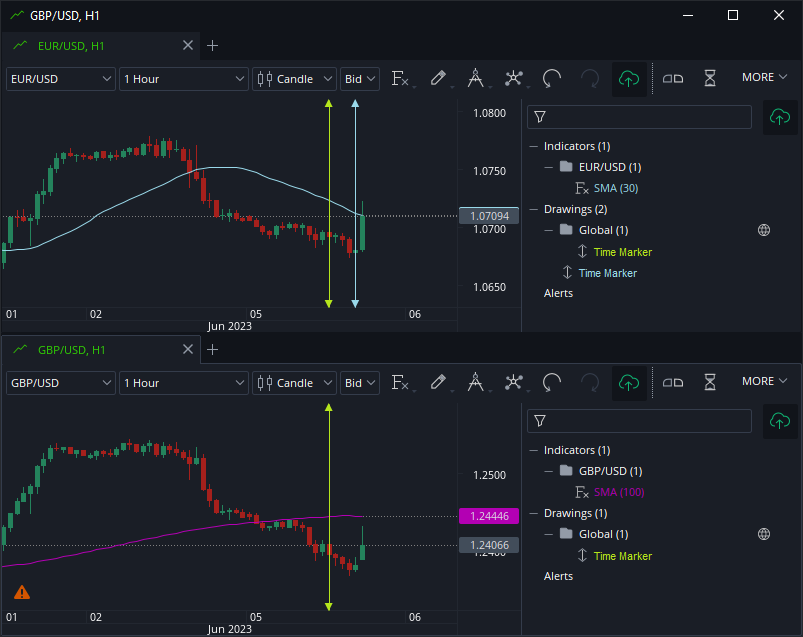
Group settings
Below is an example showing an indicator and a drawing object, which are both grouped.
- A group of the blue SMA indicator is linked to EUR/USD. It is therefore not displayed in GBP/USD chart.
- A group of the pink SMA indicator is linked to GBP/USD. It is therefore not displayed in EUR/USD chart.
- A group of the green time marker is made global (Show on all instruments is enabled). It is therefore displayed in both charts.
- Blue Time marker is linked to EUR/USD by default, so it is not displayed in GBP/USD chart.
Color group settings
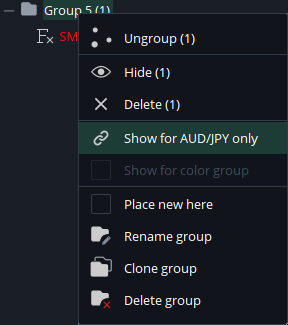
Below is an example showing a time marker, which is linked to the charts of the green color group.
- A group of the green time marker is made global (Show on all instruments is enabled), but is linked to the charts of the green color group. It is therefore not displayed in the GBP/USD chart, which does not belong to the green group (no group assigned).
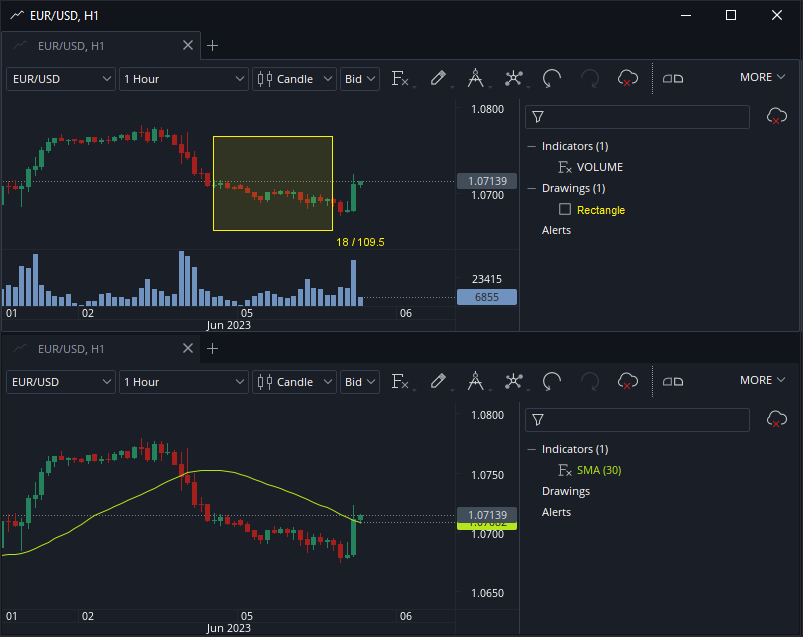
Local mode
Below is an example of 2 charts with JCloud synchronization disabled.
- All the objects are saved in each chart separately. They are not synchronized.
Layers
There are several layers in chart, which can be toggled.
The menu can be found under this button

or on right click on time or price scale in chart
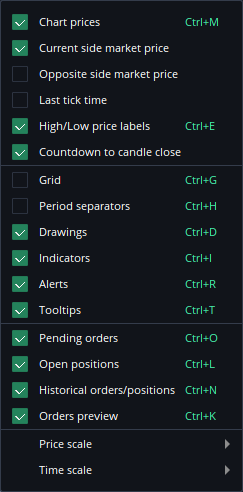
Countdown to candle close
Countdown to the candle close is showing the time left until the current candle close.
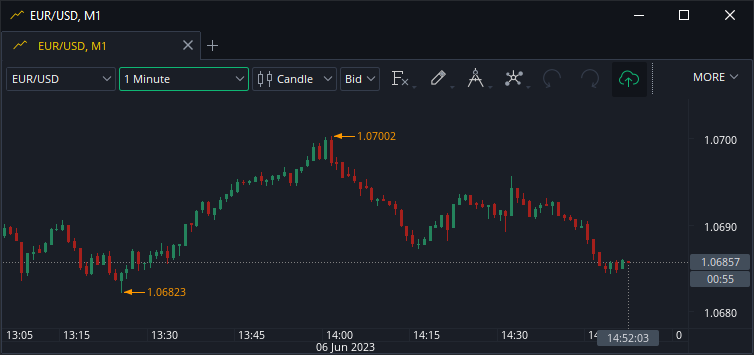
Last tick time
is showing at what time the last price update was.
Favorites
Enable this icon:

to show the FAVORITES widget on the chart.
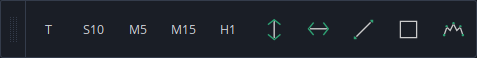
The following objects can be added into FAVORITES widget:
- Periods
- Drawings
- Retracements
- Patterns
Mark them with the star in the menu:
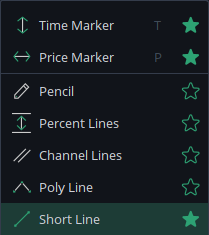
The widget can be displayed horizontally or vertically. Right click on the widget to change the layout.
Economic events
It is possible to see the ECONOMIC EVENTS on the chart.
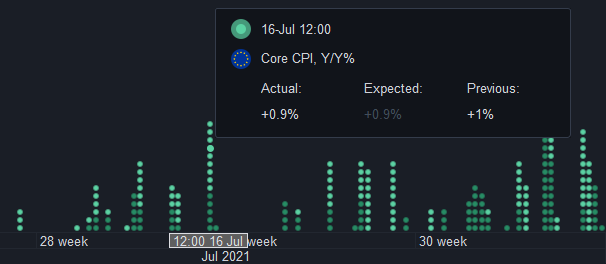
Toggle them with this button:

There are 3 importance levels:
- High
- Meddium
- Low
Only the first 2 are enabled by default. Right click the events to enable the LOW importance as well.
Replay mode
Users, who would like to test their technical analysis and chart reading skills, can repeat the price history on each chart now. Besides, they can paper trade inside that mode and check the results.
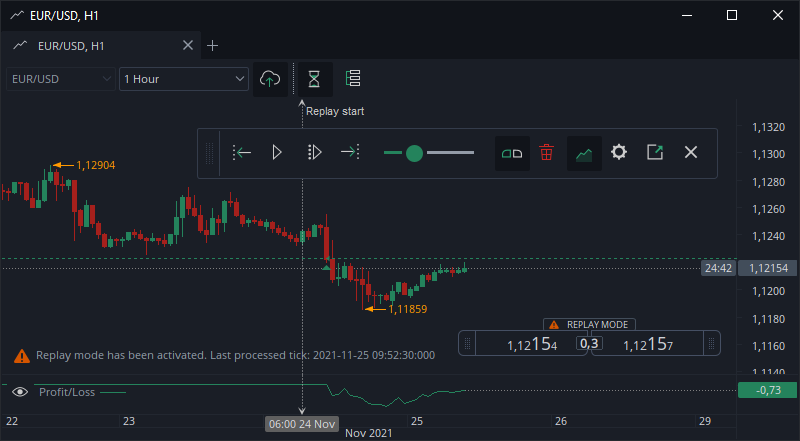
Replay mode works on each chart separately. Enable the mode by pressing on this toggle button in chart toolbar:

If Replay mode is enabled, this toolbar is shown inside the chart.
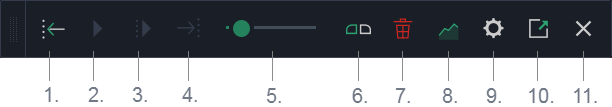
- Set start time
- Start
- Next
- Jump to current
- Speed
- Replay mode order widget
- Clear chart
- Test statistics
- Settings
- Show report
- Exit replay mode
1. Set start time
Use this tool to set the start time on chart or in data chooser. Each time the start time is changed, the order history gets lost!
2. Start
Start button. It changes to PAUSE button if pressed.
3. Next
Use this button when the test has been paused to draw the candles one by one.
4. Jump to current
This button finishes the replay and show the current candle.
5. Speed
The speed of the historical price replay can be adjusted with this slider.
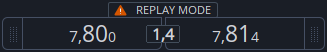
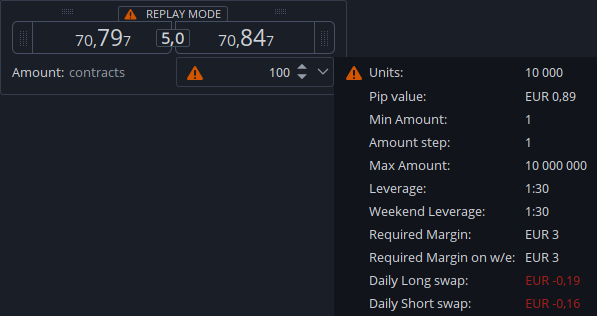
6. Replay mode order widget
In order to paper trade inside the Replay mode, activate the ORDER WIDGET. This is the only way how to open and close long and short positions as well as place pending orders.
Mouse over the widget to move it or set the amount.
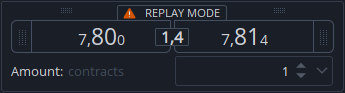
Drag the points on the left from the BID to the chart and drop to place a pending SELL order. Use the points on the right from the ASK to place a BUY pending order.
All the other settings, like MAX.SLIPPAGE, STOP LOSS or TAKE PROFIT are placed automatically according to the settings set in TRADING SETTINGS of the PREFERENCES.
The trading history of the Replay mode is not saved anywhere. Using the following functions will result in the loss of the trading history of the current replay session:
- Start time
- Settings
- Exit replay mode
7. Clear chart
This function removes all the objects from the current session, but does not reset the historical price replay.
8. Test statistics
Enable this button to show the PROFIT/LOSS and USE OF LEVERAGE for the current testing session.
9. Settings
The account settings can be set in this dialog.
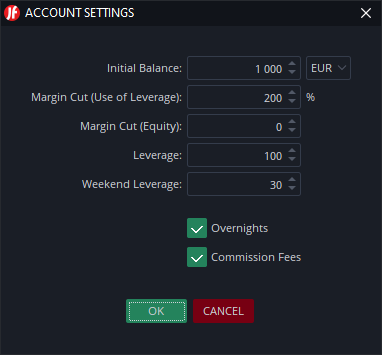
Changing them will reset the replay session.The Leverage set in this dialog is the maximum leverage of the account. It gets used only if its value is lower than the leverage of each instrument.
For example, if the account leverage is 200, but the EUR/USD leverage is 100, value of 100 will be used in margin calculation. If the account leverage is 50, the value of 50 will be used.
The leverage of each instrument can be found on mouse over on the amount spinner in REPLAY MODE NEW ORDER widget,
10. Show report
Press this button to show the report of the current session in the web browser.
11. Exit replay mode
Click to exit the replay mode.
Table view
The indicator values can be shown in the table view mode. Right click on the column headers to select.
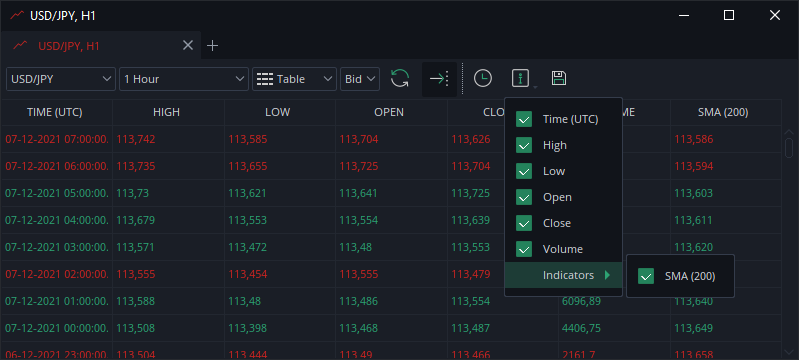
The data be copied to the clipboard in a simple way:
- Ctrl+A to select all rows
- Ctrl+C to copy them
Templates
All the chart objects, no matter what saving mode is switched on, can be saved in chart template.
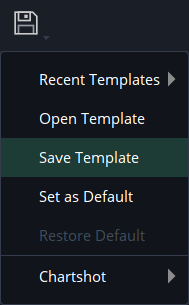
If template gets opened, chart will be switched to Local mode and will display all the objects, which were inside the template.
- If the saving mode is switched to JCloud later and objects are moved, the objects with the same IDs will be overwritten
- Objects of another color group will not be displayed
Template can be opened using Drag&Drop as well.