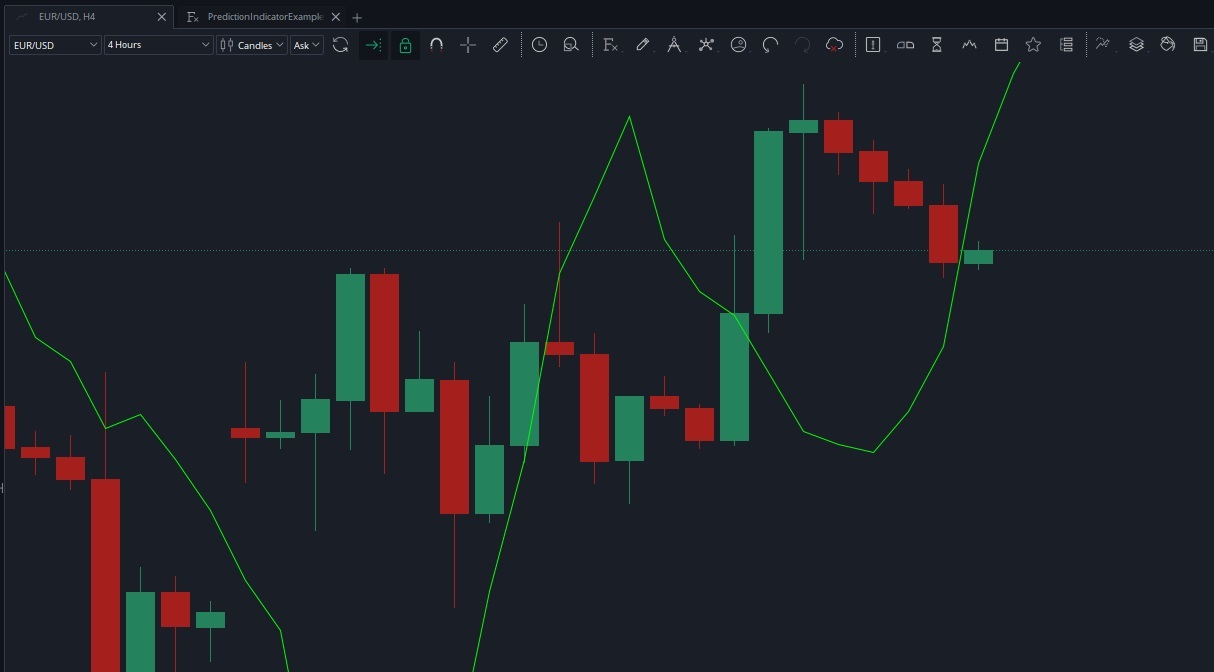
Indicator with Predicted values
Prediction Line Indicator Example
Sometimes, there is a need to draw a prediction line on a chart to visualize possible future values based on past data. The PredictionIndicatorExample demonstrates how to calculate future values using linear regression and display them on the chart as a forward-shifted line.
Purpose
This indicator analyzes the last N bars (lookback period) to calculate a trend and uses this trend to predict values for the next M bars (forecast period). The predicted values are displayed as a line shifted forward on the chart, providing a clear visual representation of future trends.
Method onStart
public void onStart(IIndicatorContext context) {
indicatorInfo = new IndicatorInfo(
"PREDICT",
"Prediction Indicator",
"Custom Example",
true,
false,
true,
1,
0,
1
);

inputParameterInfos = new InputParameterInfo[] {
new InputParameterInfo("Price", InputParameterInfo.Type.DOUBLE)
};

outputParameterInfos = new OutputParameterInfo[] {
new OutputParameterInfo("Predicted Line", OutputParameterInfo.Type.DOUBLE, OutputParameterInfo.DrawingStyle.LINE)
};

// Set the forward shift to display predicted values
outputParameterInfos[0].setShift(forecastBars);
outputParameterInfos[0].setColor(Color.GREEN);
}
Method calculate
public IndicatorResult calculate(int startIndex, int endIndex) {
// Ensure there is enough data
if (startIndex - lookback < 0) {
startIndex = lookback;
}
if (startIndex > endIndex) {
return new IndicatorResult(0, 0);
}

// Calculate the prediction for each bar
for (int i = startIndex; i <= endIndex; i++) {
outputs[0][i - startIndex] = predictNextValue(inputs[0], i - lookback, i - 1, forecastBars);
}

return new IndicatorResult(startIndex, endIndex - startIndex + 1);
}
Download
PredictionIndicatorExample.java
The information on this web site is provided only as general information, which may be incomplete or outdated. Click here for full disclaimer.