Indicator draws chart objects
With JForex-API 2.7.8 as complement to the usage of the IDrawingIndicator interface to draw the indicators one can use the IIndicatorChartPanel interface to draw the chart objects. This approach resembles the one used by strategies. For available chart objects see the Chart object catalog.
Example
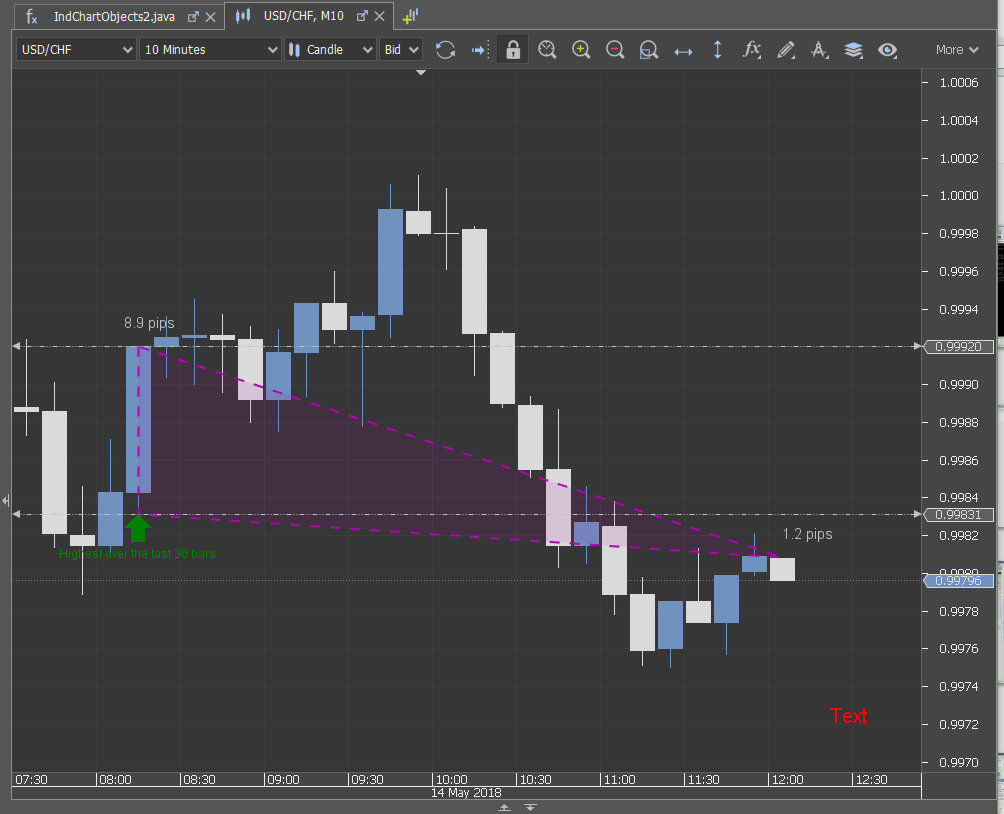
Consider an indicator which finds the highest bar in pips over the given time period and draws some chart objects according to the highest and the current bar and also the informative label.
Method onStart
private static final String GUID = UUID.randomUUID().toString();
public void onStart(IIndicatorContext context) {
        indicatorInfo = new IndicatorInfo("Chart object test", "IndObjTest",
                                          "Custom Indicators", true, false,
                                          false, 1, 1, 1);
        inputParameterInfos = new InputParameterInfo[]{
                new InputParameterInfo("Bars", InputParameterInfo.Type.BAR)};
        optInputParameterInfos = new OptInputParameterInfo[]{
                new OptInputParameterInfo(
                        "Time period",
                        OptInputParameterInfo.Type.OTHER,
                        new IntegerRangeDescription(timePeriod, 1, 200, 1))

        };
        outputParameterInfos = new OutputParameterInfo[]{
                new OutputParameterInfo(
                        "Out",
                        OutputParameterInfo.Type.DOUBLE,
                        OutputParameterInfo.DrawingStyle.LINE)
        };
        feedDescriptor = context.getFeedDescriptor();
        this.context = context;
}
Method calculate
    public IndicatorResult calculate(int startIndex, int endIndex) {
        if (startIndex - getLookback() < 0) {
            startIndex -= startIndex - getLookback();
        }
        if (startIndex > endIndex) {
            return new IndicatorResult(0, 0);
        }

        for (int i = startIndex, j = 0; i <= endIndex; i++, j++) {
            outputs[0][j] = inputs[0][i].getHigh() - inputs[0][i].getLow();
        }

        if (factory == null) {
            chart = context.getIndicatorChartPanel();
            //no chart opened - either indicator called from strategy or indicator
            if (chart == null) {
                return new IndicatorResult(startIndex, endIndex - startIndex + 1);
            }
            factory = chart.getChartObjectFactory();
        }

        double pip = feedDescriptor.getInstrument().getPipValue();
        double maxHeight = 0;
        int maxIdx = 0;
        for (int i = inputs[0].length - timePeriod - 1; i < inputs[0].length; i++) {
            double height = inputs[0][i].getHigh() - inputs[0][i].getLow();
            if (height > maxHeight) {
                maxHeight = inputs[0][i].getHigh() - inputs[0][i].getLow();
                maxIdx = i;
            }
        }
        IBar barFrom = inputs[0][maxIdx];
        IBar barTo = inputs[0][inputs[0].length - 1];

        //prefix keys with the indicator's guid, such that we don't overwrite objects of another indicator
        ITextChartObject textMax = factory.createText(
                GUID + "textMaxHeight",
                barFrom.getTime(),
                barFrom.getHigh() + pip);
        textMax.setText(
                String.format("%.1f pips", (barFrom.getHigh() - barFrom.getLow()) / pip),
                new Font(Font.DIALOG, Font.BOLD, 15));
        textMax.setStickToCandleTimeEnabled(false);
        chart.add(textMax);

        ITextChartObject textCurr = factory.createText(
                GUID + "textCurrHeight", barTo.getTime(), barTo.getHigh() + pip);
        textCurr.setText(
                String.format("%.1f pips", (barTo.getHigh() - barTo.getLow()) / pip),
                new Font(Font.DIALOG, Font.BOLD, 15));
        textMax.setStickToCandleTimeEnabled(false);
        chart.add(textCurr);

        ITriangleChartObject triangle = factory.createTriangle(GUID + "triangle",
                                                               barTo.getTime(), barTo.getOpen(),
                                                               barFrom.getTime(), barFrom.getLow(),
                                                               barFrom.getTime(), barFrom.getHigh()
        );
        triangle.setLineWidth(2);
        triangle.setLineStyle(LineStyle.DASH);
        triangle.setColor(Color.MAGENTA.darker());

        chart.add(triangle);

        ISignalUpChartObject signalUp = factory.createSignalUp(GUID + "signalUpKey",
                                                               barFrom.getTime(), barFrom.getLow()
        );
        signalUp.setText("Highest over the last " + timePeriod + " bars");
        chart.add(signalUp);

        IHorizontalLineChartObject hLineLow = factory.createPriceMarker(GUID + "hLineLow", barFrom.getLow());
        hLineLow.setLineStyle(LineStyle.DASH_DOT_DOT);
        chart.add(hLineLow);
        IHorizontalLineChartObject hLineHigh = factory.createPriceMarker(GUID + "hLineHigh", barFrom.getHigh());
        hLineHigh.setLineStyle(LineStyle.DASH_DOT_DOT);
        chart.add(hLineHigh);

        if (chart.get("screenLabel") == null) {
            IScreenLabelChartObject label = chart
                    .getChartObjectFactory().createScreenLabel(GUID + "screenLabel");
            label.setCorner(Corner.BOTTOM_RIGHT);
            label.setxDistance(50);
            label.setyDistance(50);
            label.setText("Indicator calculates bar heights in pips",
                          new Font(Font.SANS_SERIF, Font.BOLD, 20));
            label.setColor(Color.RED);
            chart.add(label);
        }
        return new IndicatorResult(startIndex, endIndex - startIndex + 1);
    }
Download
The information on this web site is provided only as general information, which may be incomplete or outdated. Click here for full disclaimer.