Customizing the User Interface
The platform provides various options to customize user interface. Once you have setup your workspace or charts, the customized settings can be saved in workspace and templates.
Show/Hide Chart Layers
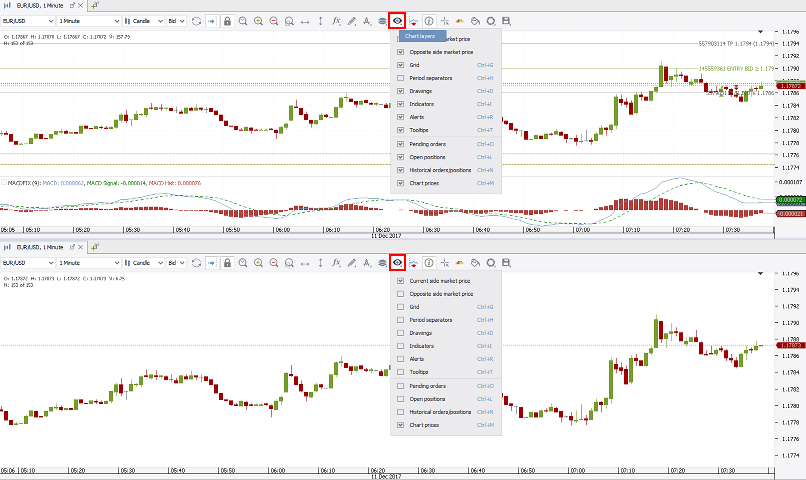
The example screenshot shows the same chart twice but each uses different chart layer settings.
To show or hide chart layers such as historical orders/positions, pending orders, indicators, etc., click on  in the icon bar above the chart and enable/disable the chart layers as needed.
You can set the settings individually for each chart.
Custom Chart Periods
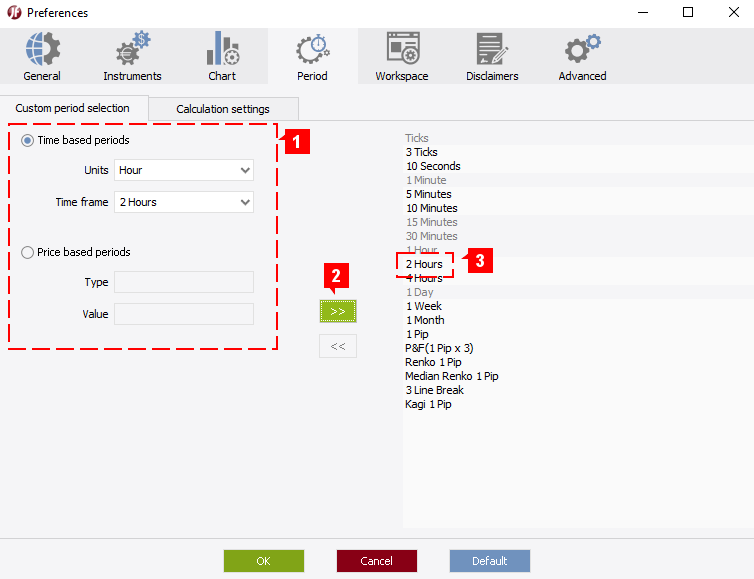
You may add custom chart periods for both time based (e.g. 2 hours) and price based charts (e.g. 2 pips Renko) in addition to the standard periods (such as 1 hour or 4 hours).
To add a custom chart period:
- Go to Settings > Preferences > Period.
- In the Period settings, create your custom period (1).
- Click on the green arrow (2) to add it to the list of periods that are available on the chart (3).
- Click on OK.
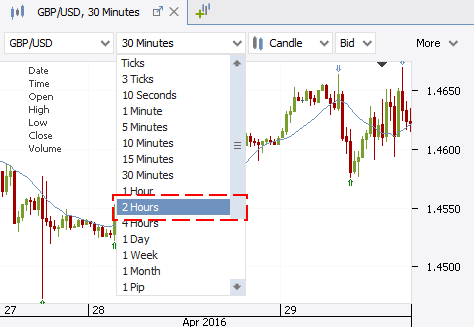
- The custom period is now available in the chart dropdown menu
Time Settings
The platform allows to customize the Platform Time Zone and the Day Start Time (charts).
Platform time zone
The time zone that is used by the platform (some components such as reports may still use GMT (UTC) time)
To change the platform time zone:
- In the top right corner of the trading platform, right-click the platform time to open the menu and select the time zone.
- Alternatively, you can go to Settings > Preferences > General and change the time zone.
Day Start Time
Allows to select the time zone for the start of the day (at 0:00) that is used by the chart, among others, for the generation of daily candles. If GMT is selected, the day start time is 0:00 GMT while for EET it would be 0:00 EET. This setting influences all chart periods, which are longer than 1 hour, e.g. 2 hours, 4 hours, 1 Day etc.
After the weekend, the marketplace reopens at 21:00 GMT in summer (or 22:00 GMT in winter). Therefore setting Day start time as GMT results in a Sunday candle (2 hours in Winter and 3 hours in Summer). This has an impact on indicators which can be avoided by setting the day start time to EET which results in five full 24h candles each week.
To change the chart day start time:
- go to Settings > Preferences > Chart
- In the Day start time section, select the time as required and close the Preferences window by clicking on OK.
Examples
In the examples below, all charts are based on the same price data for EUR/USD and show daily candles for the trading week, starting on Sunday, 19th November 2017 at 22:00 GMT until market closing on Friday, 24th November 2017 at 22:00 GMT. The broker is on winter time.
Based on the time settings, there may be five or six daily candles and the candles may cover a different period.
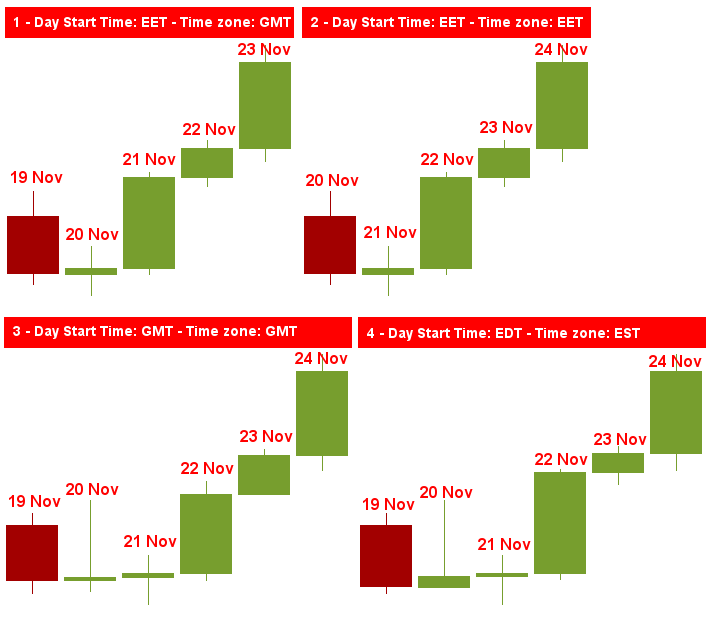
Example (1) (EET/GMT) shows five daily candles, each covering a 24h period. The daily candles appear to be 'delayed' by one day, e.g. when placing the mouse cursor on todays daily candle, yesterdays date is shown but this is actually correct. The trading week started at 0:00 EET on 20th November which in GMT terms is 22:00 GMT (broker on winter time) on 19th November. Daily candles are named after their start date. Changing both time settings to EET removes the 'delay' which can be seen in example (2).
Example (3) (GMT/GMT) shows six daily candles in total, however, not every daily candle covers a 24h period. The first daily candle (Nov 19) covers the trading activity on Sunday evening (two hours) when markets reopen after the weekend. The last daily candle covers the trading activity on Friday until market closure (22 hours).
Example (4) (EDT/EST) shows also six daily candles in total, with the first and last candle covering shorter periods.
Platform Theme (dark/light)
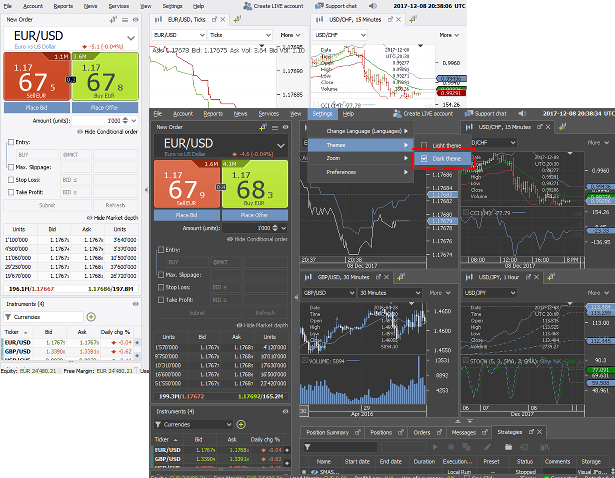
To change the platform theme from light to dark, go to Settings > Themes and select Dark theme.
Zoom
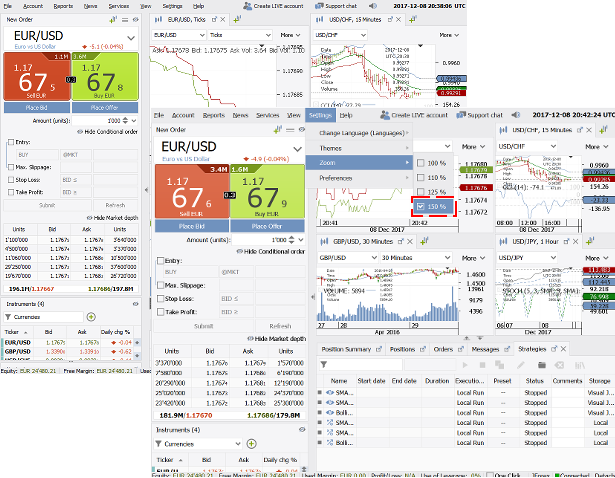
When using high-resolution displays, the platform might appear small. To increase the platform 'size', go to Settings > Zoom and select a zoom level that you find appropriate.
Alternatively, you may change the zoom level by using the mouse wheel. Click anywhere on the platform (but not the charts), press and hold Ctrl and turn the mouse wheel forth or back.
Show/Hide Panels
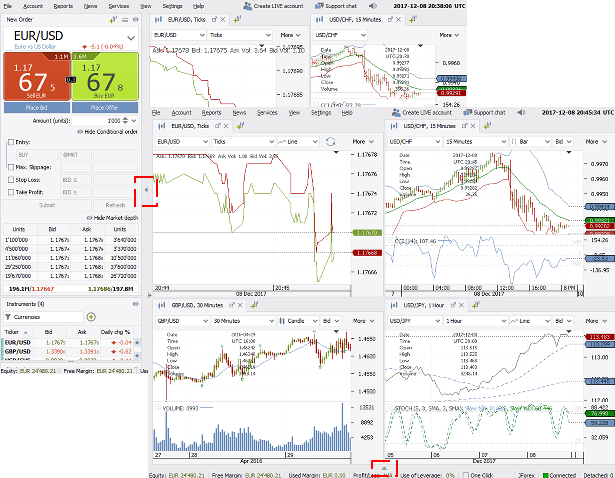
You can hide the order and tab panels. Click on the small arrows  to hide or show the panels.