Indicators
Locate Indicators
Indicators are accessed in two places:
- Navigator panel → Indicators node. Expand this node to browse the built-in indicator catalog (organized into categories) and a Custom sub-node containing any custom/imported indicators you've added. Right-click an indicator here for actions like Edit or Compile (for custom
.javaindicators). - Add Indicator dialog — opened directly from a chart. This shows the same overall catalog (built-in + custom), but in a dedicated dialog optimized for browsing, searching, and adding indicators to the active chart.
Open the Add Indicator Dialog
From an open chart, open the Add Indicator dialog using either:
- The Indicators button in the chart toolbar, or
- The keyboard shortcut F3.
The dialog lists:
- Favorites — indicators you've starred for quick access.
- Recent — indicators you've used recently.
- Category sections — built-in indicators grouped by type, e.g. Charting Techniques, Cycle Indicators, Mathematical, Momentum Indicators, Patterns, Price Reference, Statistical Indicators, Support/Resistance, Tools, Trading Sessions, Trend Indicators, Volatility Indicators, Volume Indicators. Each category shows a count of indicators it contains.
JForex4 ships with more than 250 built-in indicators across these categories. Since the list is long:
- Hover the mouse over an indicator's name to see a tooltip with its description (see screenshot below — hovering "Linear Regression" shows "Fits a straight trendline through price data. Used to determine the general direction of a trend.").
- Use the search box at the top of the dialog to filter the list by name.
- Press F4 to open a Quick search popup for indicators, letting you jump straight to one by typing part of its name without navigating the category tree.
- Click the star icon next to an indicator to add it to Favorites for faster access next time.
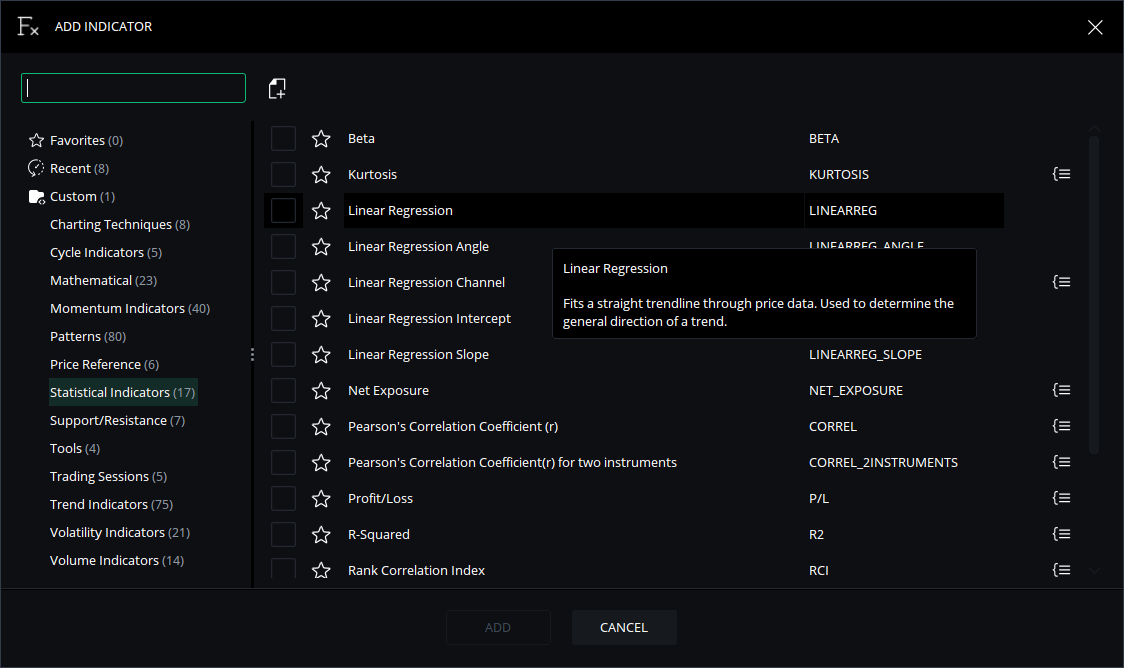
Tip: Each indicator row has a checkbox — you can check multiple indicators before clicking ADD at the bottom of the dialog to add several at once to the same chart.
Add Custom Indicators
Custom indicators (your own or third-party .java/.jfx files) are managed through JCloud, the same way custom strategies are:
- From JCloud — browse indicators shared or previously uploaded to your JCloud account.
- From local storage — click the dedicated Import button (the icon next to the search box in the Add Indicator dialog, or in the Navigator's Indicators/Custom context menu) to bring a
.javaor.jfxfile from your computer into JCloud.
Important: A custom indicator imported or created as
.javasource does not appear in the Custom section of the Add Indicator dialog — and cannot be added to any chart — until it has been successfully compiled. Only after compilation succeeds does it become listed under Custom (in both the Navigator's Indicators node and the Add Indicator dialog) and available for use. A precompiled.jfxfile, by contrast, is usable immediately upon import since it requires no further compilation.
Compile a Custom Indicator
Custom indicators exist in two file formats:
| Format | Description |
|---|---|
.java |
Editable source file. Must be compiled successfully before it can appear in the Custom list and be added to a chart. |
.jfx |
Compiled, ready-to-use file. Cannot be edited unless the source .java is available. |
To compile manually, do either of the following:
- In the Navigator panel, right-click the custom indicator under Indicators → Custom and select Compile, or
- Open it in the Code Editor and click Compile (or press F5).
Check the Messages tab to confirm the result:
Compiling... OK— the indicator compiled successfully and now appears in the Custom section of the Navigator's Indicators node and the Add Indicator dialog, ready to be added to a chart.- Error details — if compilation fails, the indicator remains unavailable for use on a chart until the errors are fixed and it compiles successfully.
Note: Built-in indicators are always precompiled and never need this step — they're available immediately in every category of the Add Indicator dialog.
Add the Indicator to a Chart
An indicator is not "started" or "run" the way a strategy is — it is attached to a chart so it can calculate and plot against price data.
- Open (or select) the chart you want to analyze.
- Open the Add Indicator dialog (chart toolbar button or F3).
- Find the indicator using the category tree, search box, or F4 Quick search, and hover to confirm its description if needed.
- For a custom indicator, make sure it has already been compiled successfully (see the Compile section above) — otherwise it will not be listed under Custom and cannot be selected.
- Check the box next to the indicator(s) you want, then click ADD.
- The Indicator Settings dialog opens automatically the first time it's applied — configure its parameters (see the Configure section below) and confirm.
Once applied, the indicator either:
- Overlays directly on the price chart (e.g., Moving Average, Bollinger Bands), or
- Plots in a separate sub-window beneath the price chart (e.g., RSI, MACD, Stochastic).
Tip: The same indicator can be applied multiple times to the same chart (e.g., two Moving Averages with different periods) or to multiple charts simultaneously, each with independent parameter settings.
Configure Indicator Parameters
- Double-click the indicator's name in the chart legend/label area, or right-click it and select Settings, to reopen the Indicator Settings dialog at any time.
- Set the values for each field exposed in the indicator code (e.g., period, price source, shift, colors, line style) — these correspond to the fields marked
@Configurablein the source (for custom indicators) or the standard parameter set (for built-in indicators). - Adjust display options such as line color, thickness, and style on the Style or Colors tab of the same dialog, if available.
- Click OK or Apply to update the chart with the new settings.
Note: There is no "preset saving" mechanism for indicators equivalent to Strategy presets — each chart remembers its own applied indicators and their configured parameter values as part of the chart/workspace layout.
Managing Indicators on a Chart
Once an indicator is applied to a chart, you can:
- Edit its settings — reopen the Indicator Settings dialog (see the Configure section above) to change parameters without removing and re-adding it.
- Hide/Show — toggle its visibility on the chart without deleting it.
- Remove — right-click the indicator in the chart legend and select Remove, or use the chart's Indicators list to delete it.
- Edit the source — for custom indicators, select Edit to open the
.javasource in the Code Editor, if the source file is available (see the Code Editor manual for details).
Reminder: If you edit and re-save a custom indicator that's already applied to a chart, you must recompile it for the changes to take effect. An indicator on the chart continues running its last-compiled version until a successful recompile.
Execution Notes
Indicators do not have the Local run / Remote run distinction that Strategies have:
| Aspect | Strategies | Indicators |
|---|---|---|
| Launch mechanism | Started/stopped as a running process (Local or Remote) | Added to / removed from a chart via the Add Indicator dialog (F3) |
| Pre-launch requirement | Must compile successfully before Start works | Custom indicators must compile successfully before they appear in Custom and can be added to a chart |
| Remote execution | Supported (runs on broker's strategy server) | Not applicable — indicators always calculate locally, driven by the chart's price data |
| Lifecycle | Runs continuously until stopped | Recalculates automatically as new price data arrives on the chart; stays attached until removed |
Tip: If your indicator is meant to be used by a strategy running remotely, its source code must be included directly within the strategy's
.javafile — the remote environment cannot load a separately compiled indicator class file.
Best Practices
- Compile custom indicators immediately after import or edit — remember they won't show up under Custom in the Add Indicator dialog, and can't be added to any chart, until compilation succeeds.
- Use F4 Quick search when you already know (or can guess) an indicator's name — it's faster than browsing categories, especially given the 250+ built-in options.
- Star frequently used indicators as Favorites so they're immediately visible at the top of the Add Indicator dialog instead of buried in a category.
- Hover before adding — use the description tooltip to confirm an unfamiliar indicator does what you expect before applying it to a chart, rather than adding it and checking afterward.
- Keep indicator parameter values sensible for the chart's timeframe — a period that works well on a Daily chart may be meaningless on a 1-minute chart.
- Limit the number of indicators per chart — too many overlays or sub-window indicators can slow down chart rendering and make analysis harder to read.
- Recompile custom indicators after every source change and verify in the Messages tab before reapplying the indicator to a chart.
- Document custom indicator logic (e.g., in code comments) if you plan to embed it inside strategy files for remote-run compatibility, since it won't appear as a separate, editable component in that context.