Forex Chart Patterns: What Trader Should Know
Forex chart patterns help traders predict market movements and trade effectively. These patterns form in price charts and indicate reversals, continuations, and breakout points. Want to learn more about specific forex patterns or how to interpret them? Read this article on the most important chart patterns.
List of contents
The fast-paced world of forex trading thrives on the constant ebb and flow of currency prices. But beneath the seemingly random price fluctuations lies a hidden language – the language of forex trading patterns. These recurring patterns on forex charts offer valuable clues about potential future price movements, empowering traders to navigate the market with greater confidence.
Imagine By understanding the different types of forex chart patterns, such as head and shoulders, ascending triangles, or double tops, traders can gain valuable insights. For instance, a head and shoulders pattern, with its distinctive three peaks (a high "head" flanked by two lower "shoulders"), can suggest a potential bearish reversal after an uptrend. Conversely, a double bottom pattern, characterized by two lows followed by a price rise, might signal a potential bullish continuation after a downtrend.
Having grasped the core concept of forex chart patterns, let's delve deeper and explore some of the most commonly encountered patterns that can signal potential trends, continuations, or reversals.
Let’s examine 10 most widely-known and utilized forex chart patterns among experienced traders.
-
Head and shoulders

The realm of forex charts can be a language unto itself, filled with cryptic symbols and geometric shapes. But for skilled traders, these patterns hold the key to unlocking valuable insights into potential price movements. Among these patterns, the Head and Shoulders (H&S) stands out as a prominent bearish reversal signal.
Imagine a forex chart depicting the price movement of a currency pair. The H&S pattern resembles a human silhouette – a central peak (the "head") flanked by two lower peaks on either side (the "shoulders"). A horizontal line, called the neckline, connects the swing lows that form the base of the head and shoulders.
The magic of the H&S pattern lies in its ability to signal a potential shift in the market sentiment. If you observe a well-defined H&S formation following a sustained uptrend, it might be hinting at a bearish reversal. Here's how it works:
- The first shoulder forms, indicating a temporary halt in the uptrend.
- The price then rallies, pushing above the previous high and forming the prominent "head." This suggests a renewed buying pressure, but potentially one that's losing momentum.
- The second shoulder forms, often at a lower level than the first shoulder, hinting at weakening bullish sentiment.
The key confirmation for the H&S pattern comes with a price break below the neckline. This breakout signifies a potential reversal of the uptrend, with sellers overpowering buyers and driving the price downwards. Traders can then interpret this as a signal to potentially exit long positions or even initiate short positions in anticipation of a continued price decline.
-
Double top and bottom

Double top pattern serves as a potential bearish reversal signal, warning traders of a possible shift from an uptrend to a downtrend.
The Double Top pattern appears when the price reaches a peak (the first "top"), experiences a minor decline, and then rallies to form another peak (the second "top") of roughly the same height. A horizontal line, called the neckline, connects the swing lows that form between the two tops.
The significance of the Double Top lies in its ability to signal a potential exhaustion of buying pressure. Here's how it unfolds:
- The first top forms after a sustained uptrend, indicating a temporary halt in the price rise
- Buyers might push the price higher again, forming the second top. However, this second attempt often falls short of the first top, hinting at a weakening bullish sentiment.
The key confirmation for the Double Top pattern comes with a price break below the neckline. This breakout signifies a potential bearish reversal. Traders can interpret this as a signal to potentially exit long positions or even initiate an order for short positions in anticipation of a continued price decline.
On the other hand, the Double Bottom pattern is the optimistic counterpart to the double top. It appears on forex charts with two consecutive lows of roughly equal depth, separated by a peak. A neckline, similar to the double top, connects the swing highs that form above the two lows.
The double bottom serves as a potential bullish reversal signal, offering a ray of hope after a downtrend. Here's how it unfolds:
- A downtrend is in effect, with the price steadily declining.
- The first low forms, indicating a temporary halt in the downward momentum.
- Buyers emerge, pushing the price up to form the peak.
- Sellers attempt to regain control, but their efforts fall short, resulting in the second low, often slightly higher than the first.
- This inability to push the price lower suggests that bearish sentiment is weakening.
The key confirmation for the double bottom pattern comes with a price break above the neckline. This breakout signifies a potential reversal of the downtrend, with buyers overcoming sellers and driving the price upwards. Traders can interpret this as a signal to potentially exit short positions or even initiate an order for long positions in anticipation of a continued price rise.
-
Candlestick chart pattern

Candlesticks are a type of price chart that visually represent the open, high, low, and closing price of a currency pair within a specific timeframe (e.g., one minute, one hour, daily). Each candlestick has a body and wicks (or shadows). The body reflects the difference between the opening and closing prices, indicating whether the price closed higher (hollow body) or lower (filled body) within that timeframe. The wicks represent the high and low price points reached during the period.
Forex patterns emerge from recurring combinations of these candlesticks. Some patterns, like the hammer or inverted hammer, might signal potential bullish reversals after a downtrend. The hammer pattern, for instance, features a long wick extending below a small body, suggesting buyers stepped in and pushed the price higher despite a possible opening at a low point. Conversely, patterns like the shooting star or bearish engulfing might indicate potential bearish reversals after an uptrend. The shooting star features a long upper wick and a small body, hinting at a failed attempt to push prices higher, while the bearish engulfing pattern completely engulfs the previous candlestick's body with its larger body, suggesting strong selling pressure.
-
Ascending Triangle patterns

Ascending triangle: Imagine a forex chart depicting the price movement of a currency pair. The ascending triangle pattern resembles a slanted funnel, formed during an uptrend. Price bounces between two converging trendlines:
- A rising trendline connects the swing highs.
- A horizontal trendline connects the swing lows.
The significance of the ascending triangle lies in its ability to signal a potential continuation of the uptrend. Here's how it unfolds:
- The price bounces between the trendlines, indicating a period of consolidation after a price surge.
- Buyers continue to be interested, pushing the price towards the rising trendline (buying pressure).
- Sellers become increasingly frustrated as their attempts to push the price lower (selling pressure) are met with buying resistance.
The key confirmation for the ascending triangle pattern comes with a price break above the rising trendline. This breakout signifies a potential continuation of the uptrend, with buyers overpowering sellers and driving the price upwards. Traders can interpret this as a signal to potentially maintain or increase long positions (buying bets) in anticipation of further gains.
-
Descending Triangle

The descending triangle pattern is the flip side of the ascending triangle, often forming during a downtrend. Similar to its counterpart, it resembles a slanted funnel, but with a downward tilt. Here, price bounces between two converging trendlines:
- A falling trendline connects the swing highs.
- A horizontal trendline connects the swing lows.
The descending triangle, however, can hint at a potential continuation of the downtrend. Here's the story:
- The price bounces between the trendlines, indicating a period of consolidation after a price decline.
- Sellers continue to exert pressure, pushing the price towards the falling trendline (selling pressure).
- Buyers attempt to regain control, but their efforts are met with selling resistance at the horizontal trendline.
The key confirmation for the descending triangle pattern comes with a price break below the falling trendline. This breakout signifies a potential continuation of the downtrend, with sellers overpowering buyers and driving the price downwards. Traders can interpret this as a signal to potentially exit long positions (buying bets) or even initiate short positions (selling bets) in anticipation of further price decline.
-
Symmetrical Triangle
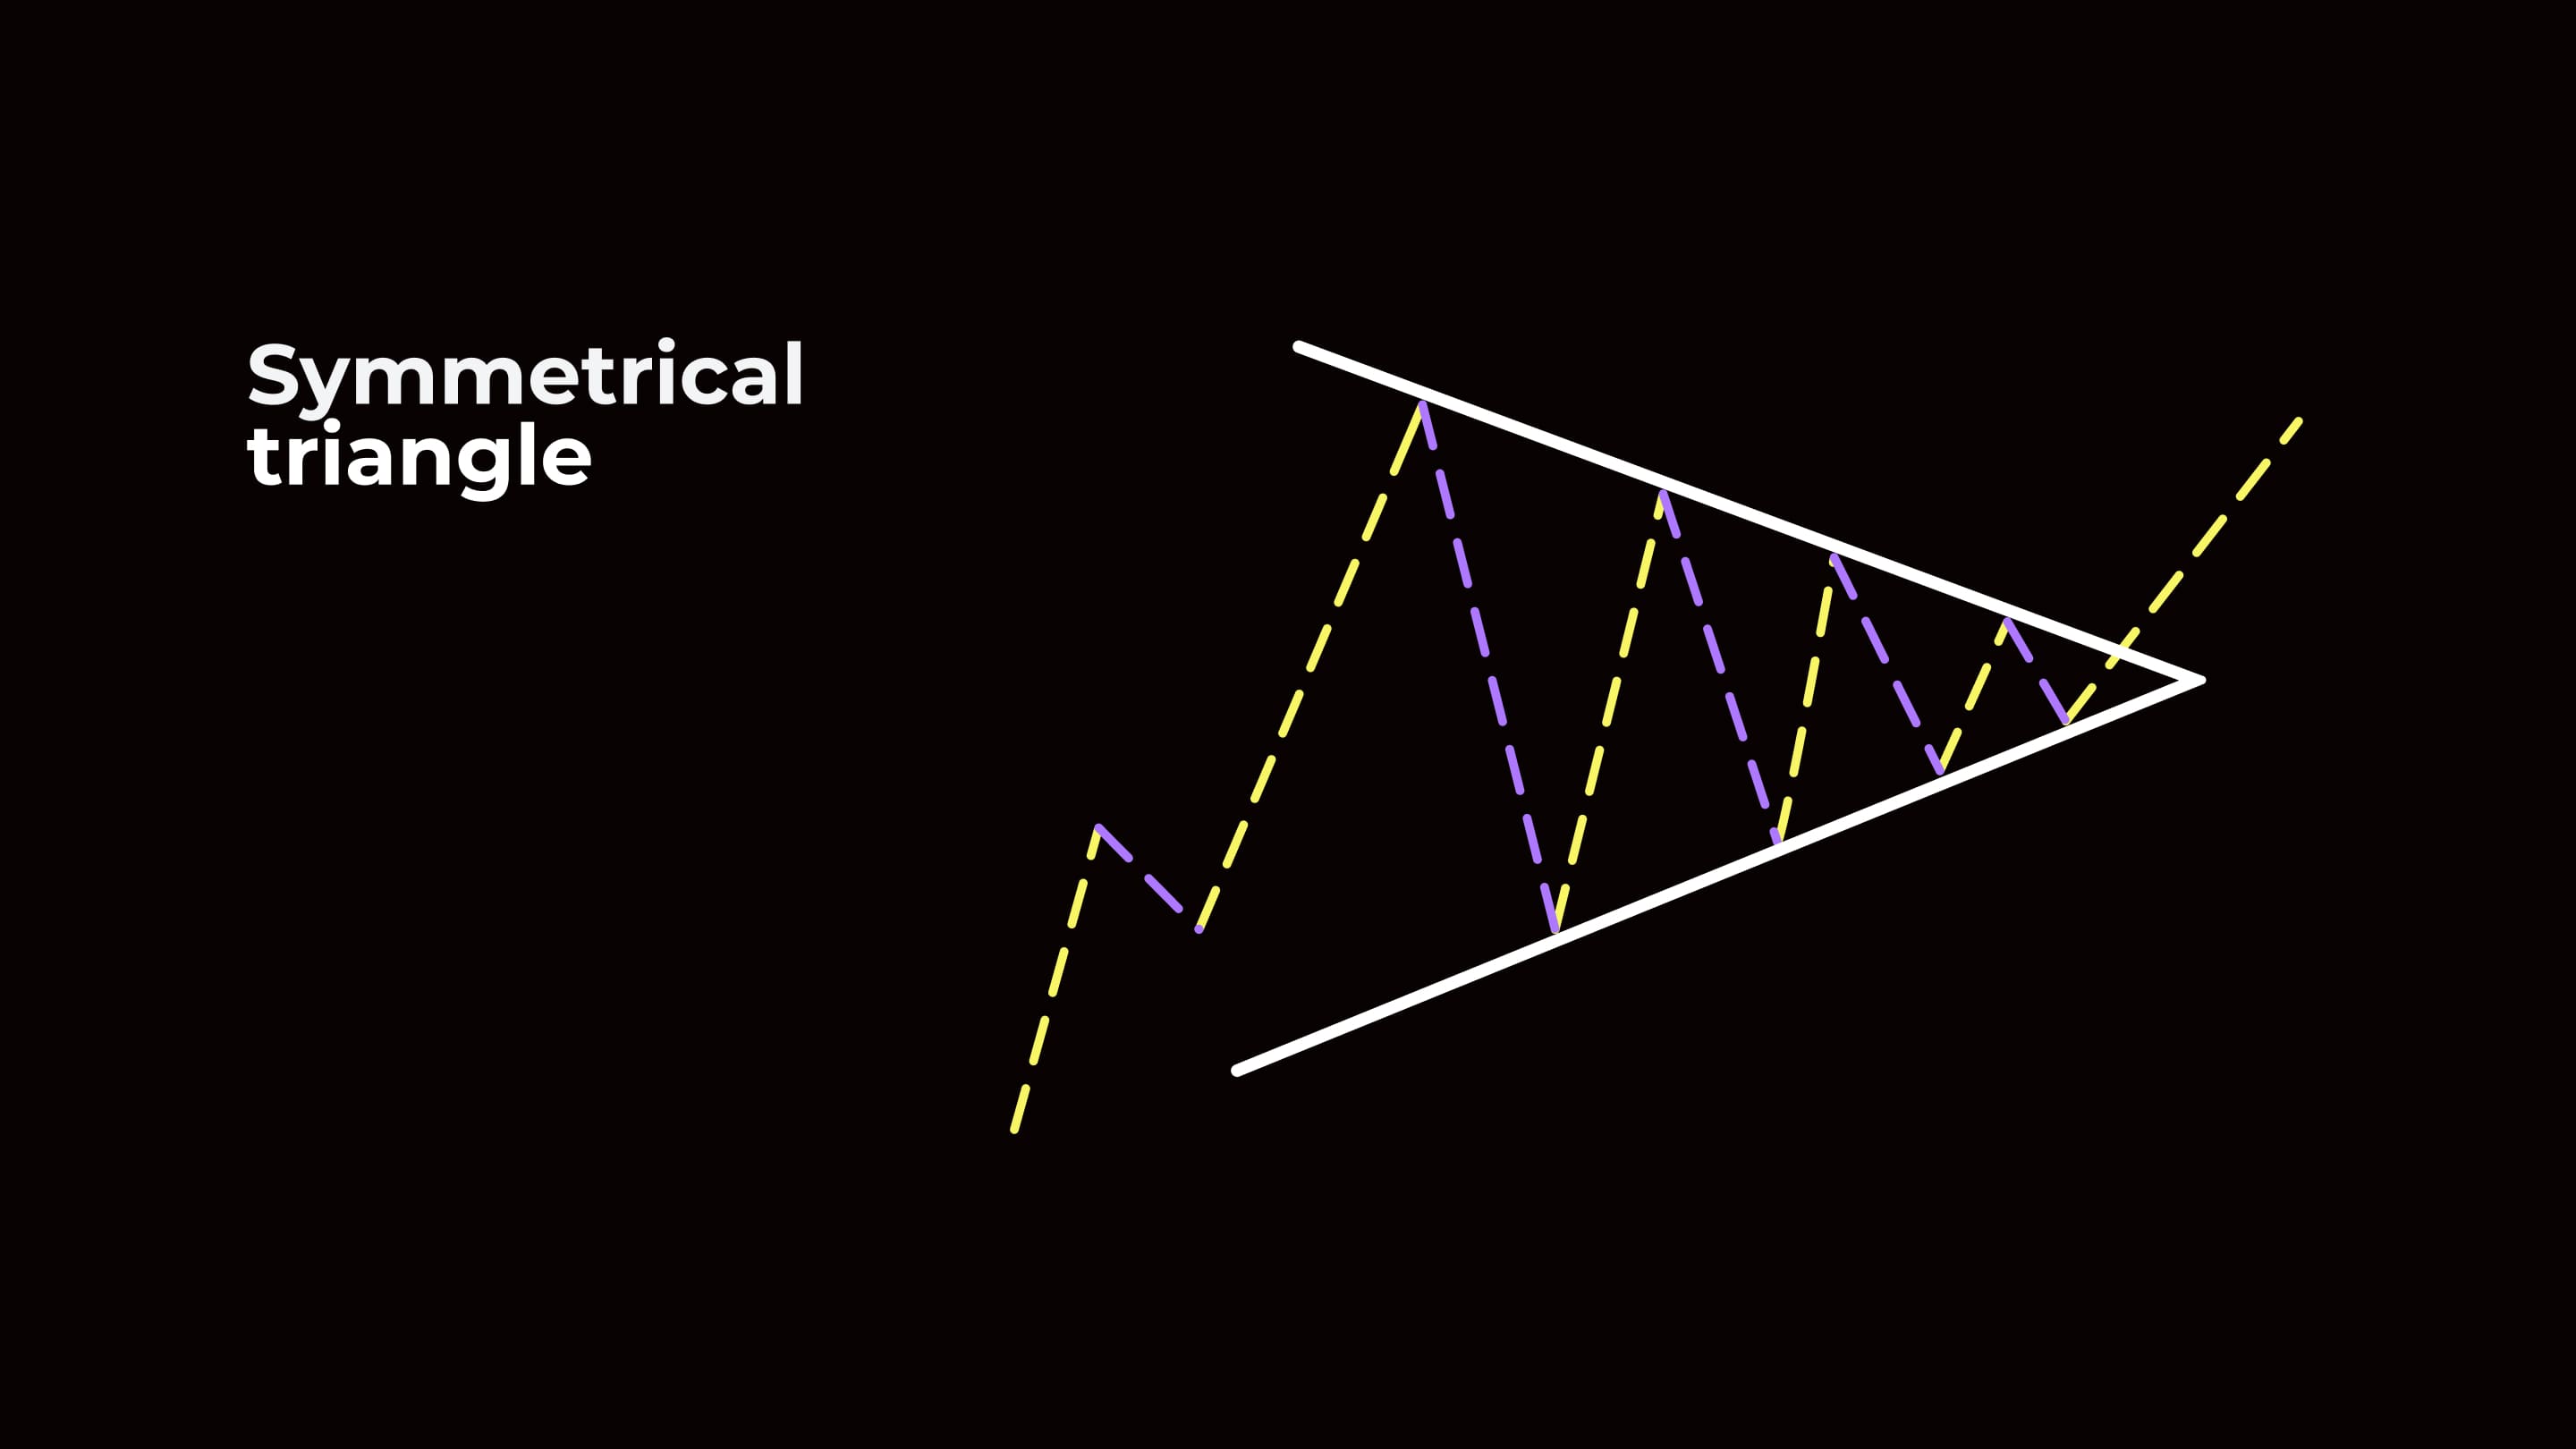
Some patterns, like the symmetrical triangle, offer a glimpse into potential future price movements, but with a twist – they don't inherently predict a direction. This unique pattern reflects a period of indecision in the market, leaving traders to decipher the next move.
Imagine a forex chart depicting the price movement of a currency pair. The symmetrical triangle pattern resembles an isosceles triangle, formed during any trend or even in a choppy market. Price bounces between two converging trendlines:
- A rising trendline connects the swing highs. This slope suggests some underlying buying pressure.
- A falling trendline connects the swing lows. This slope suggests some underlying selling pressure.
The significance of the symmetrical triangle lies in its ability to signal a potential breakout in either direction. Here's the story:
- The price bounces between the trendlines, indicating a period of consolidation. Neither buyers nor sellers can establish dominance.
- This consolidation phase can occur after a strong trend (up or down) or within a choppy, range-bound market.
The key information for the symmetrical triangle pattern comes with the breakout. A price break above the rising trendline might suggest a potential bullish reversal if preceding a downtrend, or a continuation of an uptrend. Conversely, a price break below the falling trendline might suggest a potential bearish reversal if preceding an uptrend, or a continuation of a downtrend.
-
Rising wedges

Unlike triangles, wedges have a distinct characteristic – their trendlines converge as the pattern progresses, hinting at a potential squeeze on price movement.
The rising wedge pattern, often appearing during an uptrend, resembles a funnel tilted upwards. Price bounces between two converging trendlines:
- A rising trendline connects the swing highs.
- A rising trendline (but at a shallower angle) connects the swing lows.
The significance of the rising wedge lies in its ability to signal a potential continuation or reversal of the uptrend. Here's how it unfolds:
- Continuation: If the uptrend is strong, the price might break above the upper trendline. This breakout suggests buyers overpower sellers, potentially leading to a continuation of the uptrend with increased momentum.
- Reversal: However, the converging trendlines also suggest a potential squeeze on buying pressure. If the uptrend is losing steam, a break below the lower trendline might indicate a reversal. This breakout suggests sellers overpower buyers, potentially leading to a downtrend.
-
Falling wedges

The falling wedge pattern is the inverse of the rising wedge, often forming during a downtrend. Similar to its counterpart, it resembles a funnel but tilted downwards. Price bounces between two converging trendlines:
- A falling trendline connects the swing highs.
- A falling trendline (but at a shallower angle) connects the swing lows.
The significance of the falling wedge lies in its ability to signal a potential continuation or reversal of the downtrend. Here's the breakdown:
- Continuation: If the downtrend is strong, the price might break below the lower trendline. This breakout suggests sellers overpower buyers, potentially leading to a continuation of the downtrend with increased momentum.
- Reversal: However, the converging trendlines also suggest a potential squeeze on selling pressure. If the downtrend is weakening, a break above the upper trendline might indicate a reversal. This breakout suggests buyers overpower sellers, potentially leading to an uptrend.
-
Flag patterns

This distinctive pattern serves as a potential continuation signal, offering clues about whether an existing trend is likely to resume.
The flag pattern resembles a flagpole planted on a rectangular base. The flagpole is formed by a sharp price move in the direction of the prevailing trend (up or down). This is followed by a period of consolidation, where the price bounces between two roughly parallel trendlines, forming the rectangular base (the "flag").
The significance of the flag pattern lies in its ability to signal a potential continuation of the existing trend. Here's how it unfolds:
- An uptrend or downtrend is underway.
- The flagpole forms, representing a sharp price movement that reflects strong buying or selling pressure.
- The price then enters a period of consolidation within the flag, indicating a temporary pause in the trend. This consolidation can be attributed to profit-taking by some traders or a wait-and-see approach by others before re-entering the market.
The key confirmation for the flag pattern comes with a price break out of the flag. This breakout signifies a potential resumption of the prevailing trend.
- A breakout above the upper trendline in an uptrend suggests buyers overpower sellers, potentially leading to a continuation of the uptrend with renewed momentum.
- Conversely, a breakout below the lower trendline in a downtrend suggests sellers overpower buyers, potentially leading to a continuation of the downtrend with increased momentum.
-
Rectangle chart pattern

Rectangle chart pattern is a helpful tool for identifying consolidation phases and hinting at potential future breakouts.
The rectangle chart pattern resembles a box formed by two horizontal trendlines. A horizontal support line connects the swing lows. This represents a price zone where buying pressure tends to emerge, preventing the price from falling further. Similarly, a horizontal resistance line connects the swing highs. This represents a price zone where selling pressure tends to emerge, which acts as a cap on further price appreciation.
The significance of the rectangle pattern lies in its ability to signal potential breakouts in either direction. Here's how it unfolds:
- The price bounces between the support and resistance lines, indicating a period of consolidation. Neither buyers nor sellers can establish dominance. This phase can follow a strong trend (up or down) or occur within a choppy, range-bound market.
- The longer the price remains trapped within the rectangle, the greater the buildup of pressure on one side or the other.
The key information for the rectangle pattern comes with the breakout. A price break above the resistance line might suggest a potential bullish breakout, indicating buyers overpower sellers and the price is likely to head upwards. Conversely, a price break below the support line might suggest a potential bearish breakout, indicating sellers overpower buyers and the price is likely to head downwards.
Forex chart patterns offer a valuable window into the psychology of the currency market. By recognizing these recurring patterns – from the head and shoulders signaling a potential bearish reversal to the symmetrical triangle hinting at an undecided market – traders can make more informed decisions. Remember, these patterns are not crystal balls, but rather guideposts. Always combine them with technical indicators and fundamental analysis to get a well-rounded market picture. By understanding chart patterns and using them in conjunction with other tools, you'll be better equipped to navigate the ever-changing forex landscape and potentially capitalize on both bullish and bearish opportunities.