Note: This section contains information in English only.
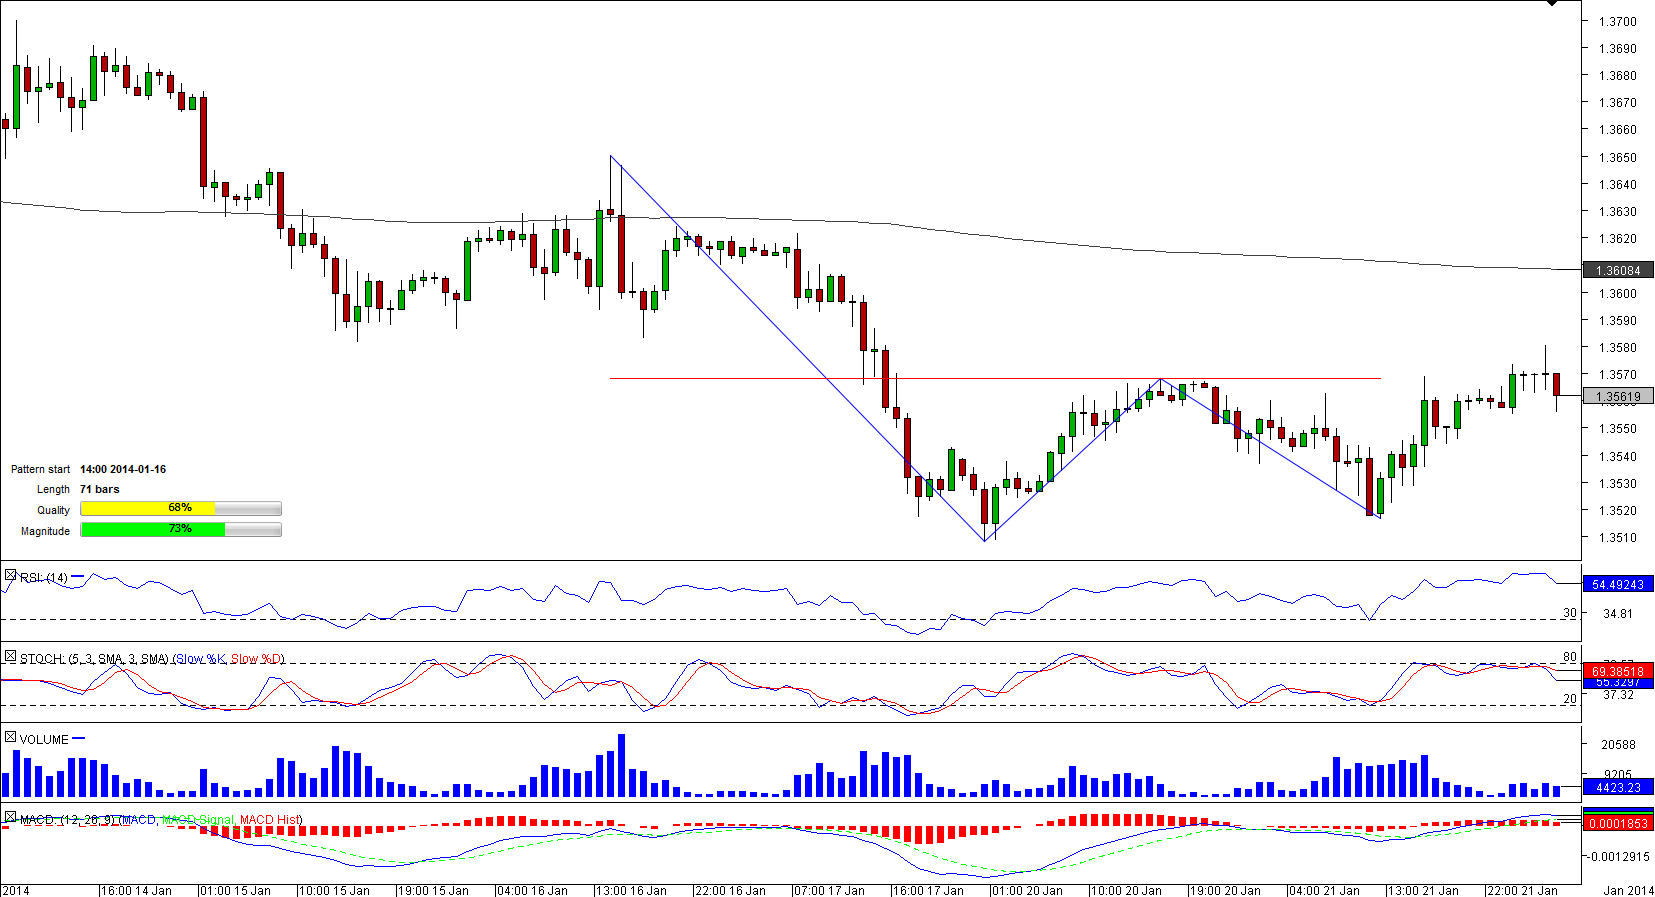
 The most traded currency couple started to shape a double bottom pattern on January 16. Several hours ago, the pair entered the most critical stage of the pattern as it reached the neck-line and if it manages to surpass this formidable resistance, it may enjoy a sharp rally. However, six hours of struggle at this level still have not brought any results and traders may start losing faith in the pair. Currently, market players do not express an uniform opinion, being bullish only in about 52% of cases. Meanwhile, technical indicators also are sending mixed signals, being bullish for short-term, neutral for medium-term and bearish for long-term.

Wed, 22 Jan 2014 06:57:47 GMT
Source: Dukascopy Bank SA
© Dukascopy Bank SA
© Dukascopy Bank SA
Actual Topics
Subscribe to "Fundamental Analysis" feed
Subscribe
Pre viac informácií o Dukascopy Bank CFD / Forex obchodných platformách a ostatných záležitostiach
nás prosím kontaktujte alebo požiadajte o hovor od nás.
nás prosím kontaktujte alebo požiadajte o hovor od nás.
For further information regarding potential cooperation,
please call us or make callback request.
please call us or make callback request.
To learn more about Dukascopy Bank Binary Options
/ Forex trading platform, SWFX and other trading related information,
please call us or make callback request.
please call us or make callback request.
Pre viac informácií o Dukascopy Bank CFD / Forex obchodných platformách a ostatných záležitostiach
nás prosím kontaktujte alebo požiadajte o hovor od nás.
nás prosím kontaktujte alebo požiadajte o hovor od nás.
To learn more about Crypto Trading / CFD / Forex trading platform, SWFX and other trading related information,
please call us or make callback request.
please call us or make callback request.
To learn more about Business Introducer and other trading related information,
please call us or make callback request.
please call us or make callback request.
For further information regarding potential cooperation,
please call us or make callback request.
please call us or make callback request.