Note: This section contains information in English only.
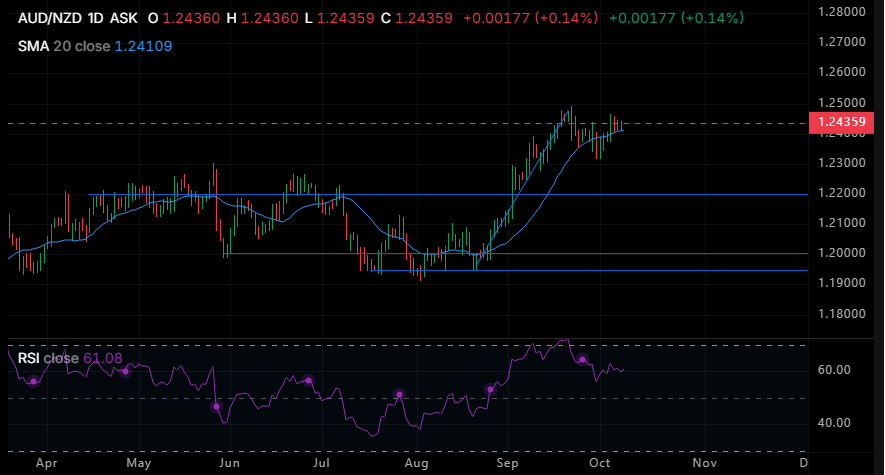
The daily AUD/NZD chart displays a bullish continuation setup following a multi-month range breakout above 1.2200, though momentum is currently consolidating after peaking near 1.2480–1.2500. The pair is finding dynamic support along the rising 20-day SMA around 1.2411, with the RSI cooling to a healthy, non-overbought 61.08. A sustained push above the 1.2480–1.2500 resistance zone signals a resumption of the broader intermediate uptrend toward 1.2600, whereas a daily close below the 20-day SMA would likely trigger a deeper mean-reversion move toward the 1.2200 prior breakout level.
Fri, 09 Oct 2026 11:12:48 GMT
Source: Dukascopy Bank SA
Actual Topics
Pre viac informácií o Dukascopy Bank CFD / Forex obchodných platformách a ostatných záležitostiach
nás prosím kontaktujte alebo požiadajte o hovor od nás.
nás prosím kontaktujte alebo požiadajte o hovor od nás.
For further information regarding potential cooperation,
please call us or make callback request.
please call us or make callback request.
To learn more about Dukascopy Bank Binary Options
/ Forex trading platform, SWFX and other trading related information,
please call us or make callback request.
please call us or make callback request.
Pre viac informácií o Dukascopy Bank CFD / Forex obchodných platformách a ostatných záležitostiach
nás prosím kontaktujte alebo požiadajte o hovor od nás.
nás prosím kontaktujte alebo požiadajte o hovor od nás.
To learn more about Crypto Trading / CFD / Forex trading platform, SWFX and other trading related information,
please call us or make callback request.
please call us or make callback request.
To learn more about Business Introducer and other trading related information,
please call us or make callback request.
please call us or make callback request.
For further information regarding potential cooperation,
please call us or make callback request.
please call us or make callback request.