Note: This section contains information in English only.
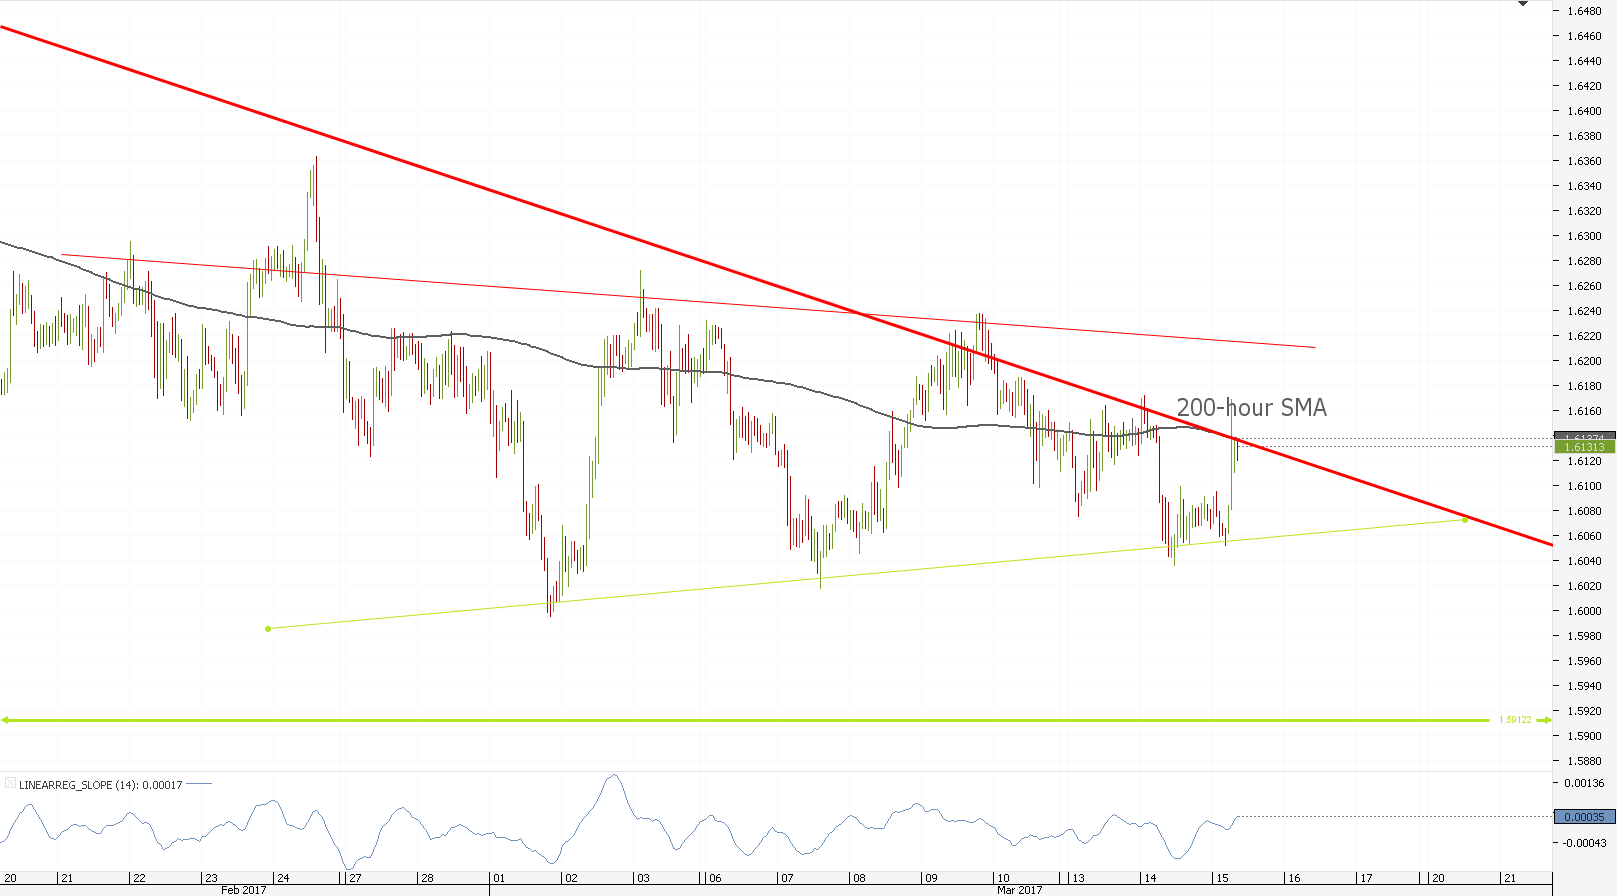
 GBP/AUD attempted to abandon the three and a half-year low of 1.5913 which it tested in October 2016, but has not been conclusively successful yet as a ranging motion has emerged on several time frames. The pair has sketched a symmetrical triangle on the hourly chart which suggests that the downward motion should extend below the critical area. The rate has also formed a descending triangle on the daily time-frame and just hit the upper trend-line which serves a s an additional bearish signal. The next target therefore lies below at 1.6058 with hitches at 1.6105 and 1.6093, respectively.

Wed, 15 Mar 2017 11:36:12 GMT
Source: Dukascopy Bank SA
© Dukascopy Bank SA
© Dukascopy Bank SA
Actual Topics
Subscribe to "Fundamental Analysis" feed
Subscribe
Pre viac informácií o Dukascopy Bank CFD / Forex obchodných platformách a ostatných záležitostiach
nás prosím kontaktujte alebo požiadajte o hovor od nás.
nás prosím kontaktujte alebo požiadajte o hovor od nás.
For further information regarding potential cooperation,
please call us or make callback request.
please call us or make callback request.
To learn more about Dukascopy Bank Binary Options
/ Forex trading platform, SWFX and other trading related information,
please call us or make callback request.
please call us or make callback request.
Pre viac informácií o Dukascopy Bank CFD / Forex obchodných platformách a ostatných záležitostiach
nás prosím kontaktujte alebo požiadajte o hovor od nás.
nás prosím kontaktujte alebo požiadajte o hovor od nás.
To learn more about Crypto Trading / CFD / Forex trading platform, SWFX and other trading related information,
please call us or make callback request.
please call us or make callback request.
To learn more about Business Introducer and other trading related information,
please call us or make callback request.
please call us or make callback request.
For further information regarding potential cooperation,
please call us or make callback request.
please call us or make callback request.