Note: This section contains information in English only.
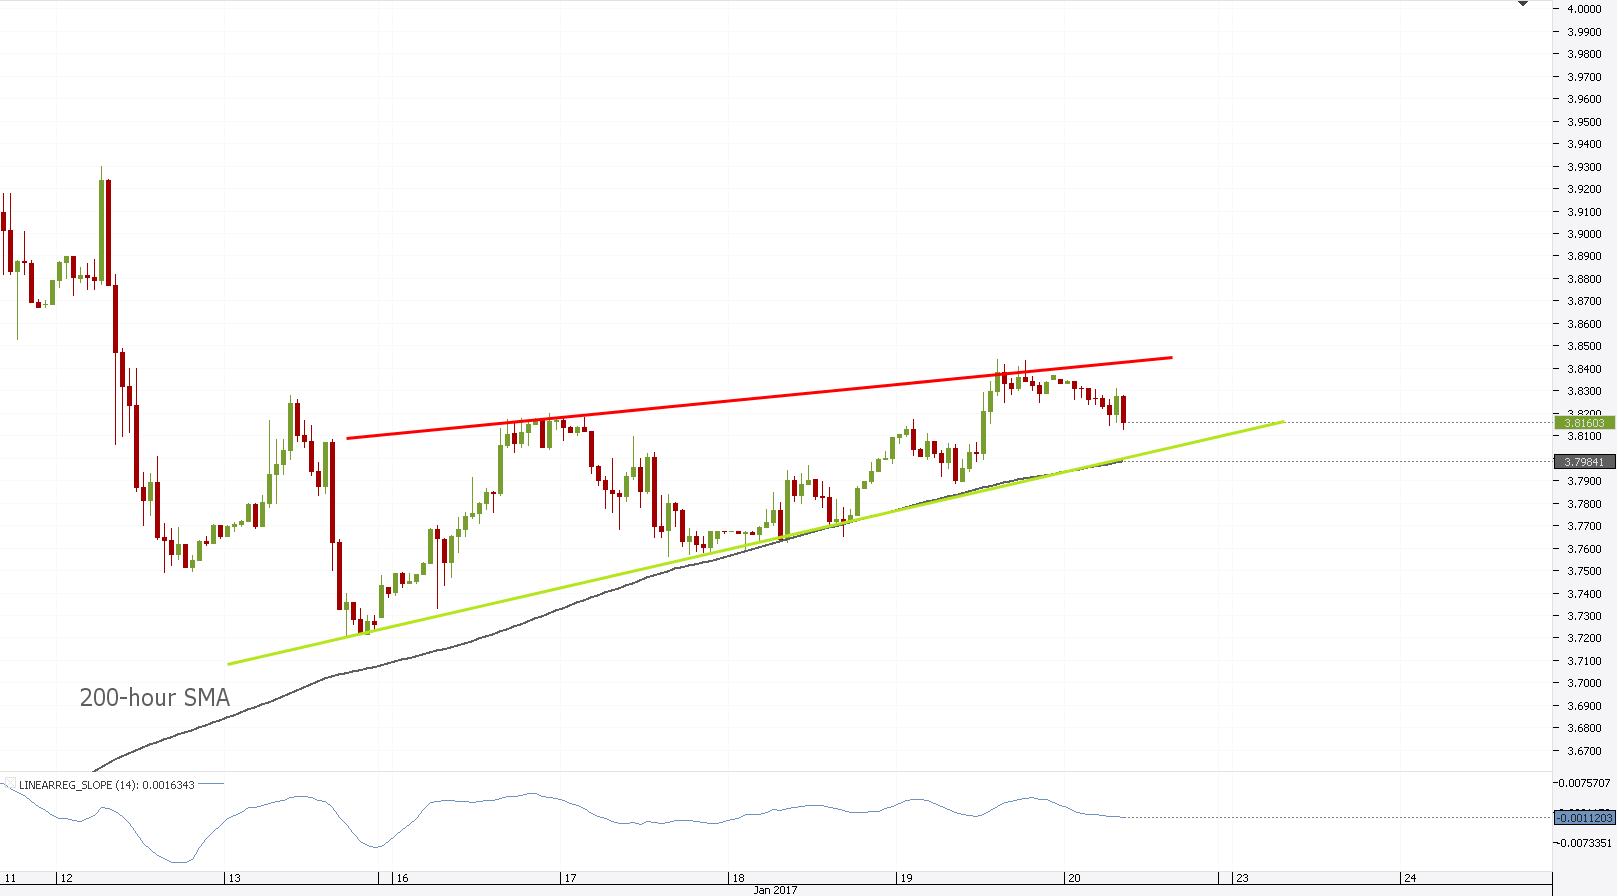
 Bearish potential led USD/TRY to sketch a rising wedge to potentially end the ranging market phase. The pair is still trading inside the pattern and is now targeting the bottom trend-line of it to potentially stick to it and then break it. The boundary lies at 3.8039 and is strengthened by the 200-hour SMA with other time frame SMAs also lying just pips away. A cloud support lies just below the pattern and in case of a break below, it will open the way to 3.7504, the monthly R2. A surge will be cut around 3.8349 or 3.8425, which will initiate a wave south.

Fri, 20 Jan 2017 09:08:24 GMT
Source: Dukascopy Bank SA
© Dukascopy Bank SA
© Dukascopy Bank SA
Actual Topics
Subscribe to "Fundamental Analysis" feed
Subscribe
Pre viac informácií o Dukascopy Bank CFD / Forex obchodných platformách a ostatných záležitostiach
nás prosím kontaktujte alebo požiadajte o hovor od nás.
nás prosím kontaktujte alebo požiadajte o hovor od nás.
For further information regarding potential cooperation,
please call us or make callback request.
please call us or make callback request.
To learn more about Dukascopy Bank Binary Options
/ Forex trading platform, SWFX and other trading related information,
please call us or make callback request.
please call us or make callback request.
Pre viac informácií o Dukascopy Bank CFD / Forex obchodných platformách a ostatných záležitostiach
nás prosím kontaktujte alebo požiadajte o hovor od nás.
nás prosím kontaktujte alebo požiadajte o hovor od nás.
To learn more about Crypto Trading / CFD / Forex trading platform, SWFX and other trading related information,
please call us or make callback request.
please call us or make callback request.
To learn more about Business Introducer and other trading related information,
please call us or make callback request.
please call us or make callback request.
For further information regarding potential cooperation,
please call us or make callback request.
please call us or make callback request.