Note: This section contains information in English only.
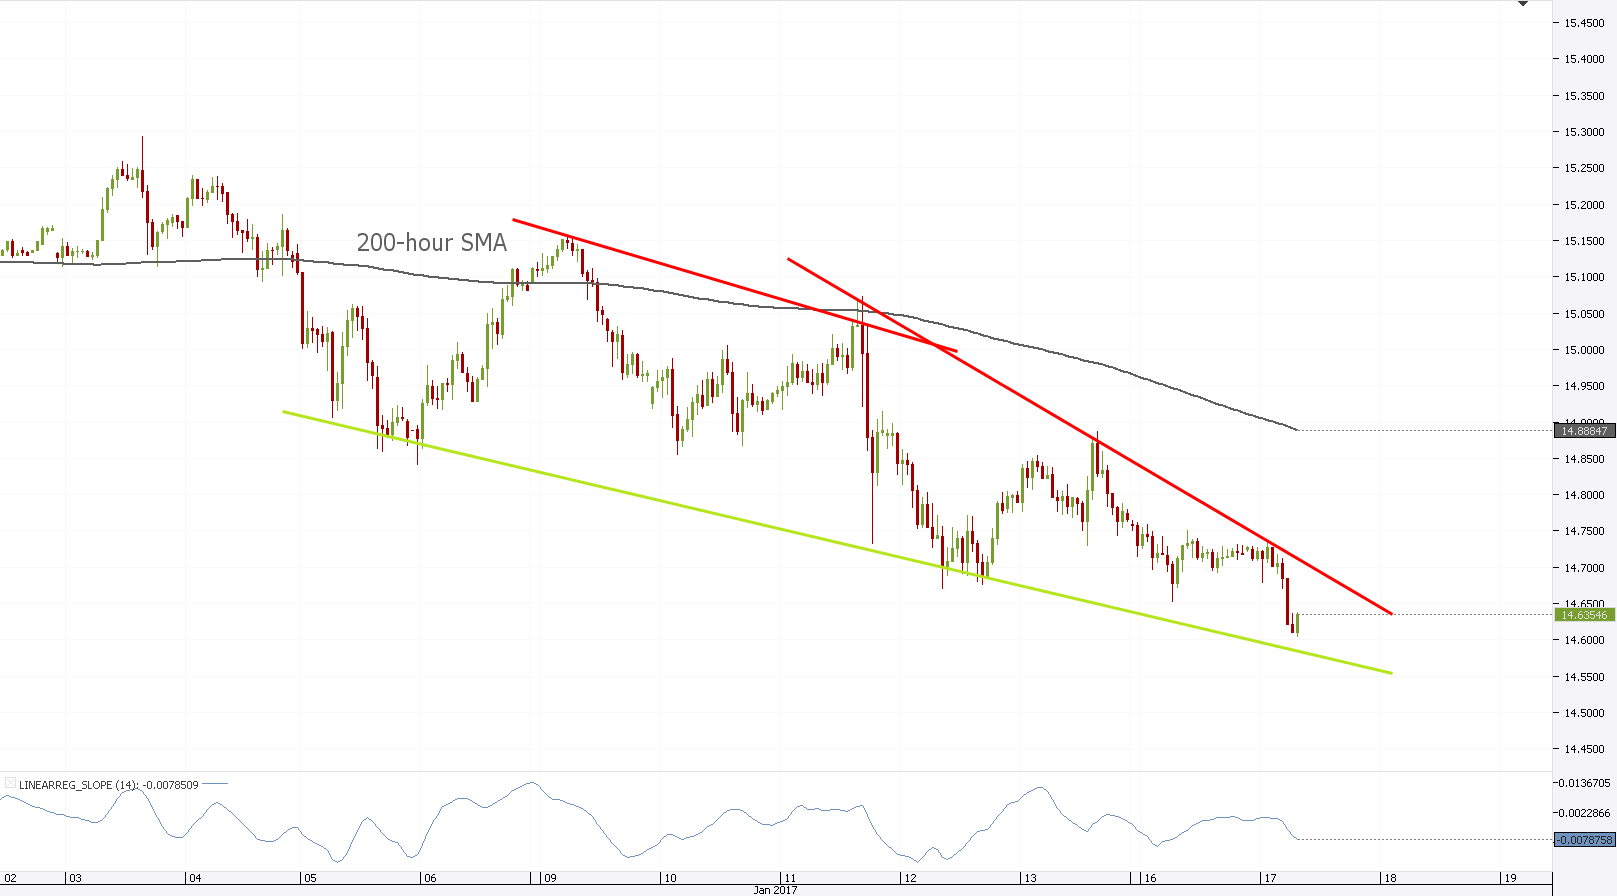
 HKD/JPY almost reached for yearly highs in December and January, but set a ceiling at 15.24 instead, falling slightly short of the ultimate high at 15.60. The pair had set a solid trading range during December and January which can now be considered a double top formation with a broken neckline at 14.98. A slide underneath has led inside a falling wedge, which signals that the bearish trend is unsustainable and that bulls might regain control in the nearest future. With the rate currently targeting the bottom trend-line of the patter at 14.58, the next wave up could be critical as it can either let the rate pass 14.69 and extend a rally, or fail at the area to test the pattern's boundaries some more.

Tue, 17 Jan 2017 09:00:04 GMT
Source: Dukascopy Bank SA
© Dukascopy Bank SA
© Dukascopy Bank SA
Actual Topics
Subscribe to "Fundamental Analysis" feed
Subscribe
Pre viac informácií o Dukascopy Bank CFD / Forex obchodných platformách a ostatných záležitostiach
nás prosím kontaktujte alebo požiadajte o hovor od nás.
nás prosím kontaktujte alebo požiadajte o hovor od nás.
For further information regarding potential cooperation,
please call us or make callback request.
please call us or make callback request.
To learn more about Dukascopy Bank Binary Options
/ Forex trading platform, SWFX and other trading related information,
please call us or make callback request.
please call us or make callback request.
Pre viac informácií o Dukascopy Bank CFD / Forex obchodných platformách a ostatných záležitostiach
nás prosím kontaktujte alebo požiadajte o hovor od nás.
nás prosím kontaktujte alebo požiadajte o hovor od nás.
To learn more about Crypto Trading / CFD / Forex trading platform, SWFX and other trading related information,
please call us or make callback request.
please call us or make callback request.
To learn more about Business Introducer and other trading related information,
please call us or make callback request.
please call us or make callback request.
For further information regarding potential cooperation,
please call us or make callback request.
please call us or make callback request.