Note: This section contains information in English only.
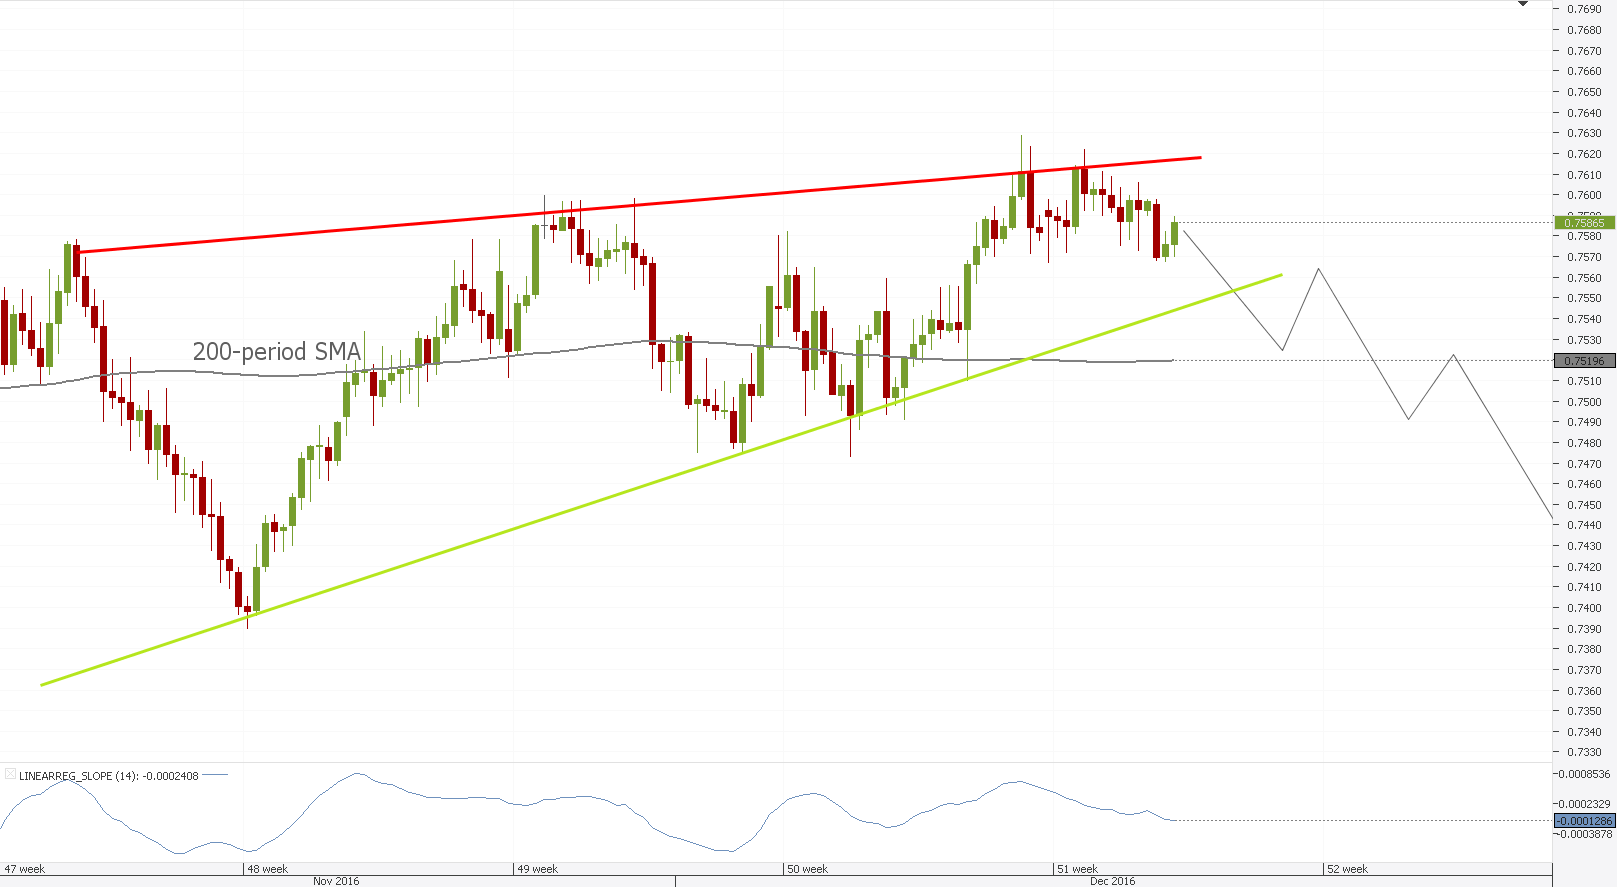
 After a quick recovery from the US Presidential Election dive, AUD/CHF entered a rising wedge to show some decent bullish momentum, but build up bearish potential at the same time. The pair is now hovering mid-pattern and we will watch 0.7543 closely for signals of a potential breakout. The latest wave south pointed out some stickiness of the bottom trend-line, meaning that the pattern might be mature enough to break. However, a close below will require strong supply, as the 0.7550/7520 area is bolstered by a multitude of support levels, corresponding to various time-frame SMAs and an Ichimoku cloud.

Wed, 14 Dec 2016 09:00:05 GMT
Source: Dukascopy Bank SA
© Dukascopy Bank SA
© Dukascopy Bank SA
Actual Topics
Subscribe to "Fundamental Analysis" feed
Subscribe
Pre viac informácií o Dukascopy Bank CFD / Forex obchodných platformách a ostatných záležitostiach
nás prosím kontaktujte alebo požiadajte o hovor od nás.
nás prosím kontaktujte alebo požiadajte o hovor od nás.
For further information regarding potential cooperation,
please call us or make callback request.
please call us or make callback request.
To learn more about Dukascopy Bank Binary Options
/ Forex trading platform, SWFX and other trading related information,
please call us or make callback request.
please call us or make callback request.
Pre viac informácií o Dukascopy Bank CFD / Forex obchodných platformách a ostatných záležitostiach
nás prosím kontaktujte alebo požiadajte o hovor od nás.
nás prosím kontaktujte alebo požiadajte o hovor od nás.
To learn more about Crypto Trading / CFD / Forex trading platform, SWFX and other trading related information,
please call us or make callback request.
please call us or make callback request.
To learn more about Business Introducer and other trading related information,
please call us or make callback request.
please call us or make callback request.
For further information regarding potential cooperation,
please call us or make callback request.
please call us or make callback request.