Note: This section contains information in English only.
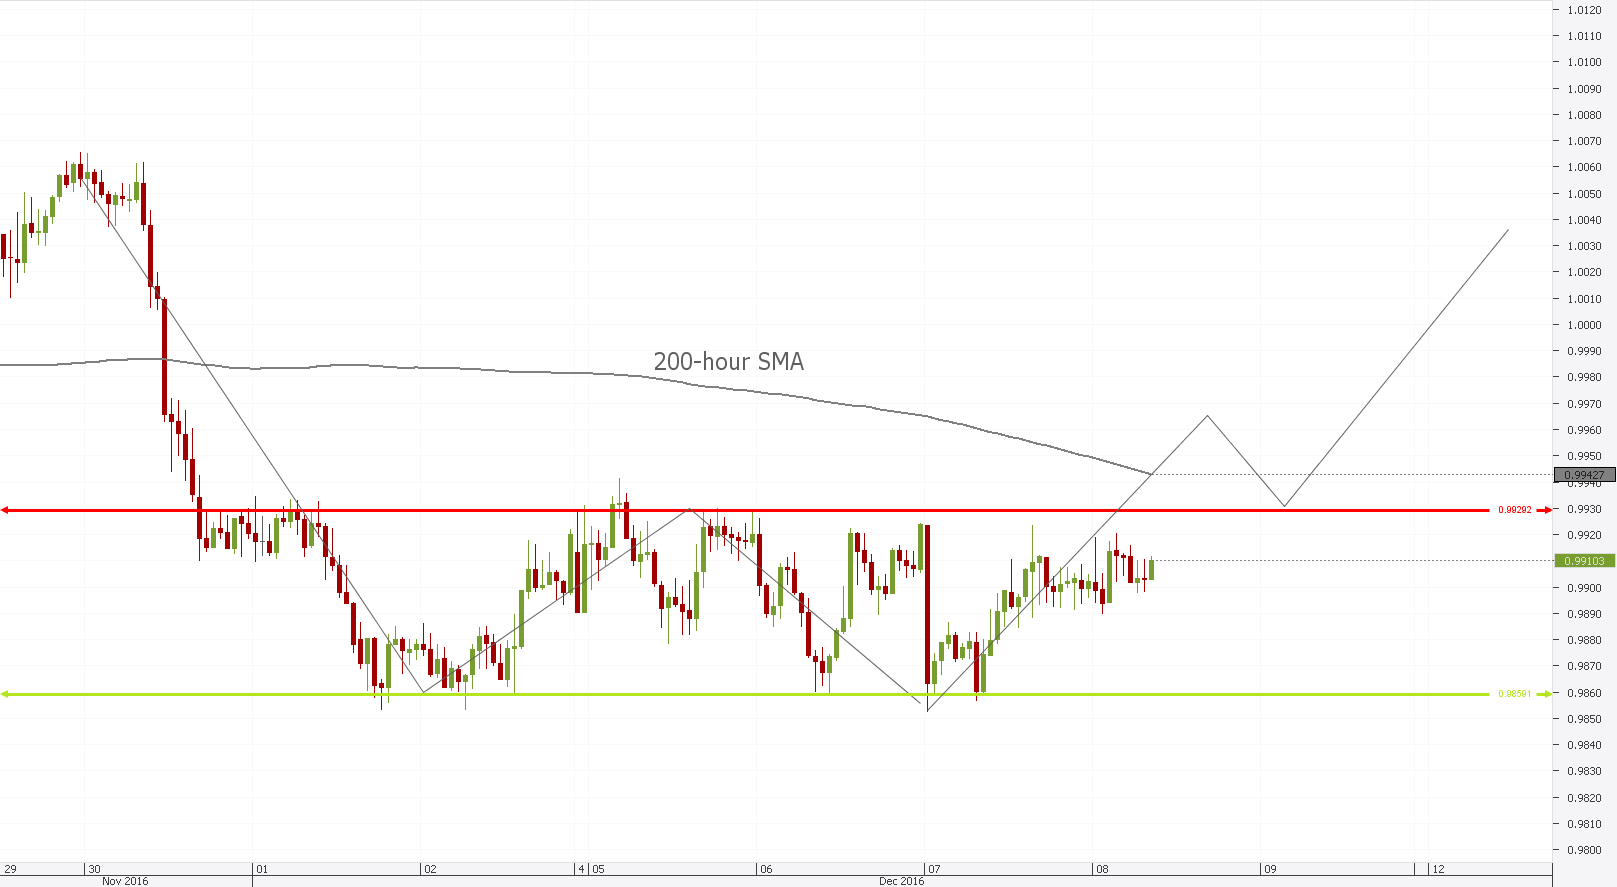
 Following a failed attempt at forming a double bottom at 0.9859, AUD/CAD entered a ranging market within a rectangle pattern. With supply and demand being in balance, it is now hard to tell whether a reversal is still on the table. We will look for signals at the support or resistance – 0.9859 and 0.9929 respectively – in order to tell whether the motion south will continue or not. The pair is now on its way up and will face 0.9914 in the nearest movements. A set of demand pressures below, such as the 20 and 100-period SMAs, a red Ichimoku cloud, the daily Pivot Point and bottom Bollinger Band bolster the floor and limit downside potential, suggesting that a reversal could follow.

Thu, 08 Dec 2016 09:02:04 GMT
Source: Dukascopy Bank SA
© Dukascopy Bank SA
© Dukascopy Bank SA
Actual Topics
Subscribe to "Fundamental Analysis" feed
Subscribe
Pre viac informácií o Dukascopy Bank CFD / Forex obchodných platformách a ostatných záležitostiach
nás prosím kontaktujte alebo požiadajte o hovor od nás.
nás prosím kontaktujte alebo požiadajte o hovor od nás.
For further information regarding potential cooperation,
please call us or make callback request.
please call us or make callback request.
To learn more about Dukascopy Bank Binary Options
/ Forex trading platform, SWFX and other trading related information,
please call us or make callback request.
please call us or make callback request.
Pre viac informácií o Dukascopy Bank CFD / Forex obchodných platformách a ostatných záležitostiach
nás prosím kontaktujte alebo požiadajte o hovor od nás.
nás prosím kontaktujte alebo požiadajte o hovor od nás.
To learn more about Crypto Trading / CFD / Forex trading platform, SWFX and other trading related information,
please call us or make callback request.
please call us or make callback request.
To learn more about Business Introducer and other trading related information,
please call us or make callback request.
please call us or make callback request.
For further information regarding potential cooperation,
please call us or make callback request.
please call us or make callback request.