Note: This section contains information in English only.


Wed, 03 Feb 2016 14:22:07 GMT
Source: Dukascopy Bank SA
© Dukascopy Bank SA
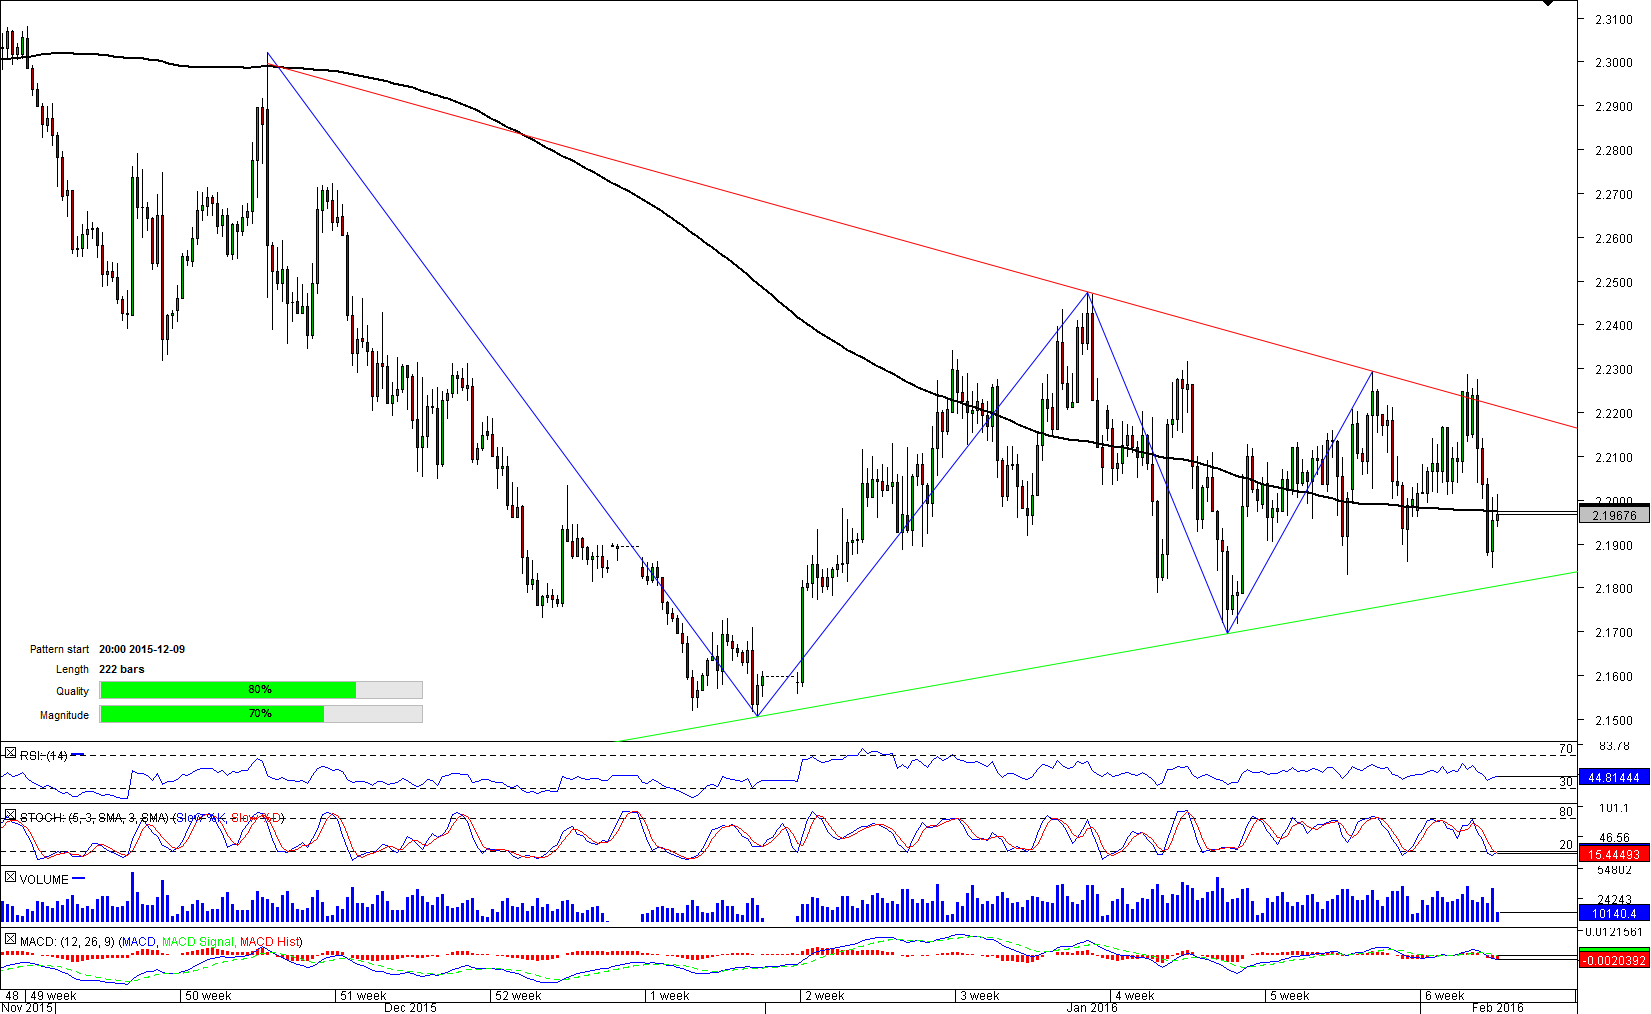
GBP/NZD keeps filling space between two boundaries of the current triangle pattern, where it has been hovering since early December 2015. Current move implies a down-leg to 2.18 where the cross is awaited to meet the green up-trend and the first weekly support level—weekly S1. Normally currency pairs are unable to perfectly reach apexes of triangles, meaning probability of an upcoming break-out is quite high. More bearish momentum is being created by a cluster of many resistances in 100-pip area between 2.1980 and 2.2080. At the moment losses are estimated by strongly bearish weekly technical studies. Consolidation below 2.18 will expose 2.1550 (weekly S2; monthly S1) and January 2016 low at 2.1506.
© Dukascopy Bank SA
Actual Topics
Subscribe to "Fundamental Analysis" feed
Subscribe
Pre viac informácií o Dukascopy Bank CFD / Forex obchodných platformách a ostatných záležitostiach
nás prosím kontaktujte alebo požiadajte o hovor od nás.
nás prosím kontaktujte alebo požiadajte o hovor od nás.
For further information regarding potential cooperation,
please call us or make callback request.
please call us or make callback request.
To learn more about Dukascopy Bank Binary Options
/ Forex trading platform, SWFX and other trading related information,
please call us or make callback request.
please call us or make callback request.
Pre viac informácií o Dukascopy Bank CFD / Forex obchodných platformách a ostatných záležitostiach
nás prosím kontaktujte alebo požiadajte o hovor od nás.
nás prosím kontaktujte alebo požiadajte o hovor od nás.
To learn more about Crypto Trading / CFD / Forex trading platform, SWFX and other trading related information,
please call us or make callback request.
please call us or make callback request.
To learn more about Business Introducer and other trading related information,
please call us or make callback request.
please call us or make callback request.
For further information regarding potential cooperation,
please call us or make callback request.
please call us or make callback request.