Note: This section contains information in English only.
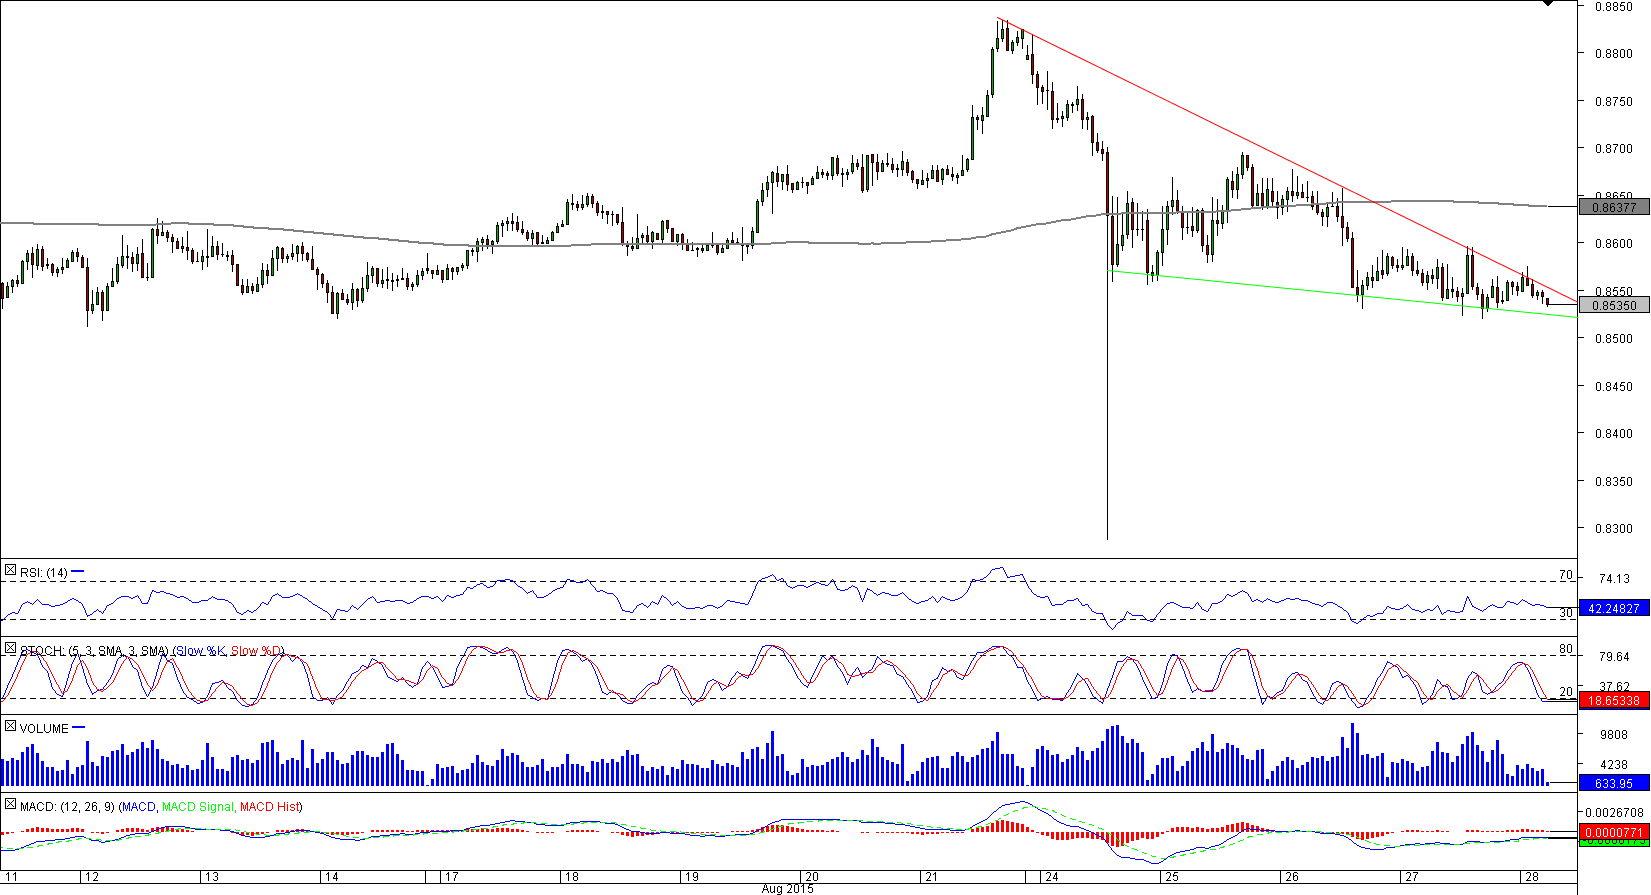
 There is a high risk of a rally in the hourly chart of NZD/CAD, even though ideally we would want the currency pair for form this pattern at the end of a bearish trend. Nevertheless, the base scenario is a breach of the red trend-line, in which case the initial target is going to be the weekly S1 and Aug 27 high at 0.86. The next objective will be the 200-hour SMA, followed by the Aug 25 high and weekly PP at 0.87. The final target would be so far the highest point in August, namely 0.8833. A dip beneath 0.8520 should lead to a decline down to 0.8442, with a likely follow-up sell-off to 0.8327. Meanwhile, the positioning is skewed in favour of the bulls: they take up 64% of the market.

Fri, 28 Aug 2015 06:46:04 GMT
Source: Dukascopy Bank SA
© Dukascopy Bank SA
© Dukascopy Bank SA
Actual Topics
Subscribe to "Fundamental Analysis" feed
Subscribe
Pre viac informácií o Dukascopy Bank CFD / Forex obchodných platformách a ostatných záležitostiach
nás prosím kontaktujte alebo požiadajte o hovor od nás.
nás prosím kontaktujte alebo požiadajte o hovor od nás.
For further information regarding potential cooperation,
please call us or make callback request.
please call us or make callback request.
To learn more about Dukascopy Bank Binary Options
/ Forex trading platform, SWFX and other trading related information,
please call us or make callback request.
please call us or make callback request.
Pre viac informácií o Dukascopy Bank CFD / Forex obchodných platformách a ostatných záležitostiach
nás prosím kontaktujte alebo požiadajte o hovor od nás.
nás prosím kontaktujte alebo požiadajte o hovor od nás.
To learn more about Crypto Trading / CFD / Forex trading platform, SWFX and other trading related information,
please call us or make callback request.
please call us or make callback request.
To learn more about Business Introducer and other trading related information,
please call us or make callback request.
please call us or make callback request.
For further information regarding potential cooperation,
please call us or make callback request.
please call us or make callback request.