Note: This section contains information in English only.
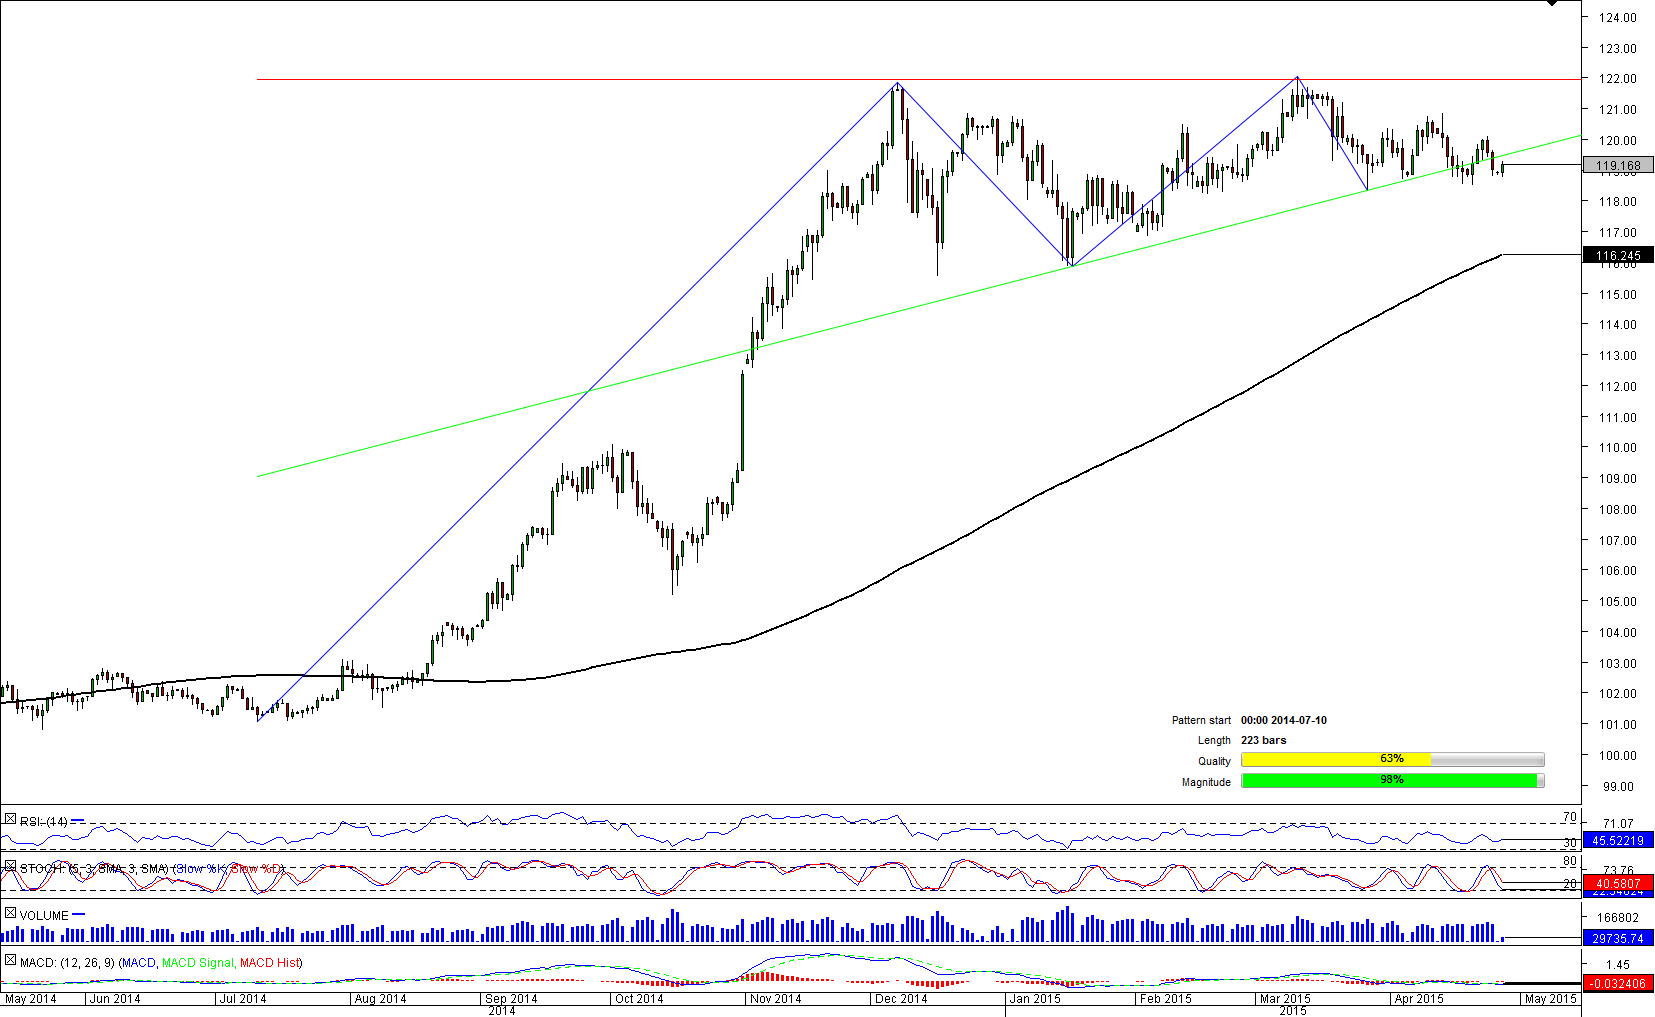
 Starting from July 2014, the US Dollar surged considerably against the Japanese Yen. However, the upward tendency was stopped by strong supply at 122. Since then, the pair has been trading in a narrowing range and mostly sideways, which led to emergence of the ascending triangle pattern. Currently, the pair is testing the lower boundary of the pattern, while 100-day SMA should be strong enough to provide bulls with necessary impetus for future growth. In case the monthly PP at 120.16 is breached, the pair will then focus on 122 (2014 high; monthly R1). Meanwhile, the idea of a bullish scenario is shared by weekly technical indicators. Moreover, almost 74% of SWFX market participants are bullish on the Greenback versus the Yen.

Mon, 27 Apr 2015 08:22:08 GMT
Source: Dukascopy Bank SA
© Dukascopy Bank SA
© Dukascopy Bank SA
Actual Topics
Subscribe to "Fundamental Analysis" feed
Subscribe
Pre viac informácií o Dukascopy Bank CFD / Forex obchodných platformách a ostatných záležitostiach
nás prosím kontaktujte alebo požiadajte o hovor od nás.
nás prosím kontaktujte alebo požiadajte o hovor od nás.
For further information regarding potential cooperation,
please call us or make callback request.
please call us or make callback request.
To learn more about Dukascopy Bank Binary Options
/ Forex trading platform, SWFX and other trading related information,
please call us or make callback request.
please call us or make callback request.
Pre viac informácií o Dukascopy Bank CFD / Forex obchodných platformách a ostatných záležitostiach
nás prosím kontaktujte alebo požiadajte o hovor od nás.
nás prosím kontaktujte alebo požiadajte o hovor od nás.
To learn more about Crypto Trading / CFD / Forex trading platform, SWFX and other trading related information,
please call us or make callback request.
please call us or make callback request.
To learn more about Business Introducer and other trading related information,
please call us or make callback request.
please call us or make callback request.
For further information regarding potential cooperation,
please call us or make callback request.
please call us or make callback request.