Note: This section contains information in English only.
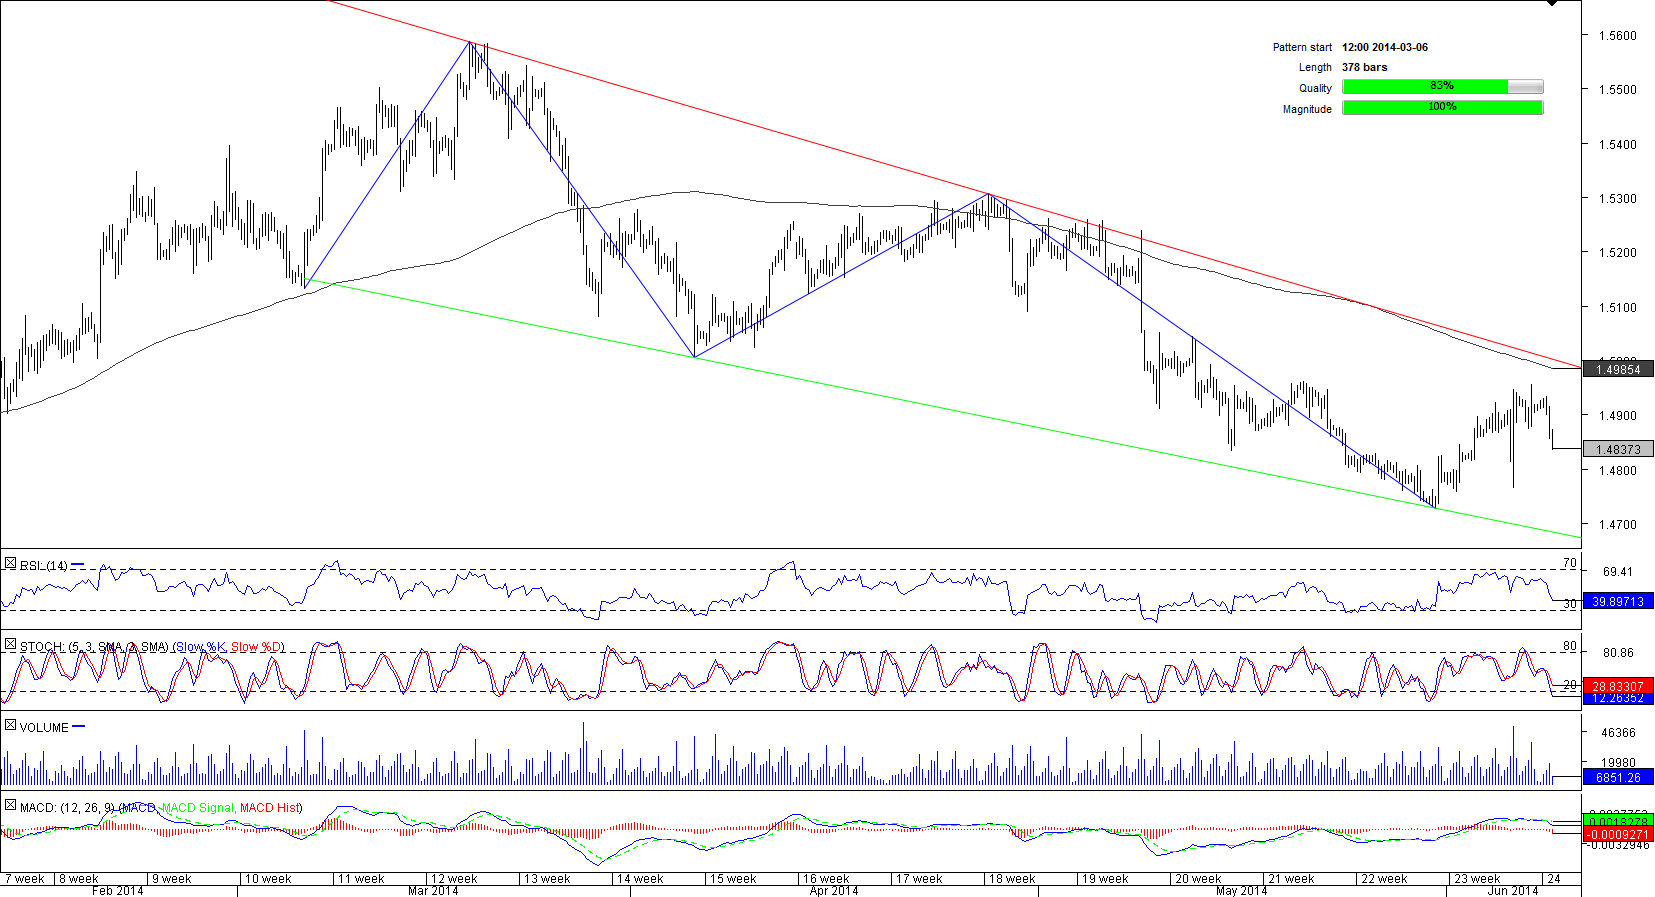
 Following a prolonged rally EUR/CAD encountered a tough resistance area near 1.56 in the mid-March, which forced the currency pair to change its direction. However, there are already signs that the initiated sell-off is gradually subsiding, such as the four-hour technical indicators pointing upwards and the price chart forming a falling wedge—a reversal pattern. Still, the Euro has to break a cluster at 1.50 (weekly R1, three-month down-trend and 200-period SMA) in order to confirm the long-term bearish intentions. Meanwhile, it seems the exchange rate is going to test the lower boundary of the falling wedge at 1.4684 before it gathers enough strength to challenge 1.50.

Mon, 09 Jun 2014 14:12:10 GMT
Source: Dukascopy Bank SA
© Dukascopy Bank SA
© Dukascopy Bank SA
Actual Topics
Subscribe to "Fundamental Analysis" feed
Subscribe
Pre viac informácií o Dukascopy Bank CFD / Forex obchodných platformách a ostatných záležitostiach
nás prosím kontaktujte alebo požiadajte o hovor od nás.
nás prosím kontaktujte alebo požiadajte o hovor od nás.
For further information regarding potential cooperation,
please call us or make callback request.
please call us or make callback request.
To learn more about Dukascopy Bank Binary Options
/ Forex trading platform, SWFX and other trading related information,
please call us or make callback request.
please call us or make callback request.
Pre viac informácií o Dukascopy Bank CFD / Forex obchodných platformách a ostatných záležitostiach
nás prosím kontaktujte alebo požiadajte o hovor od nás.
nás prosím kontaktujte alebo požiadajte o hovor od nás.
To learn more about Crypto Trading / CFD / Forex trading platform, SWFX and other trading related information,
please call us or make callback request.
please call us or make callback request.
To learn more about Business Introducer and other trading related information,
please call us or make callback request.
please call us or make callback request.
For further information regarding potential cooperation,
please call us or make callback request.
please call us or make callback request.