Now is the right time to make some profit on the pair, as a bullish breakout from a triangle pattern usually leads to an accelerating advancement of the instrument. If these ideas come true, the pair may sequentially target three important resistance zones at 0.9528/9 (four-hour R1, daily R1), 0.9540/56 (four-hour R2, R3; daily R2) and 0.9595 (daily R3). In case the pair succeeds in overcoming these levels, a five-year high at 0.9661 will seem more attainable.
Note: This section contains information in English only.
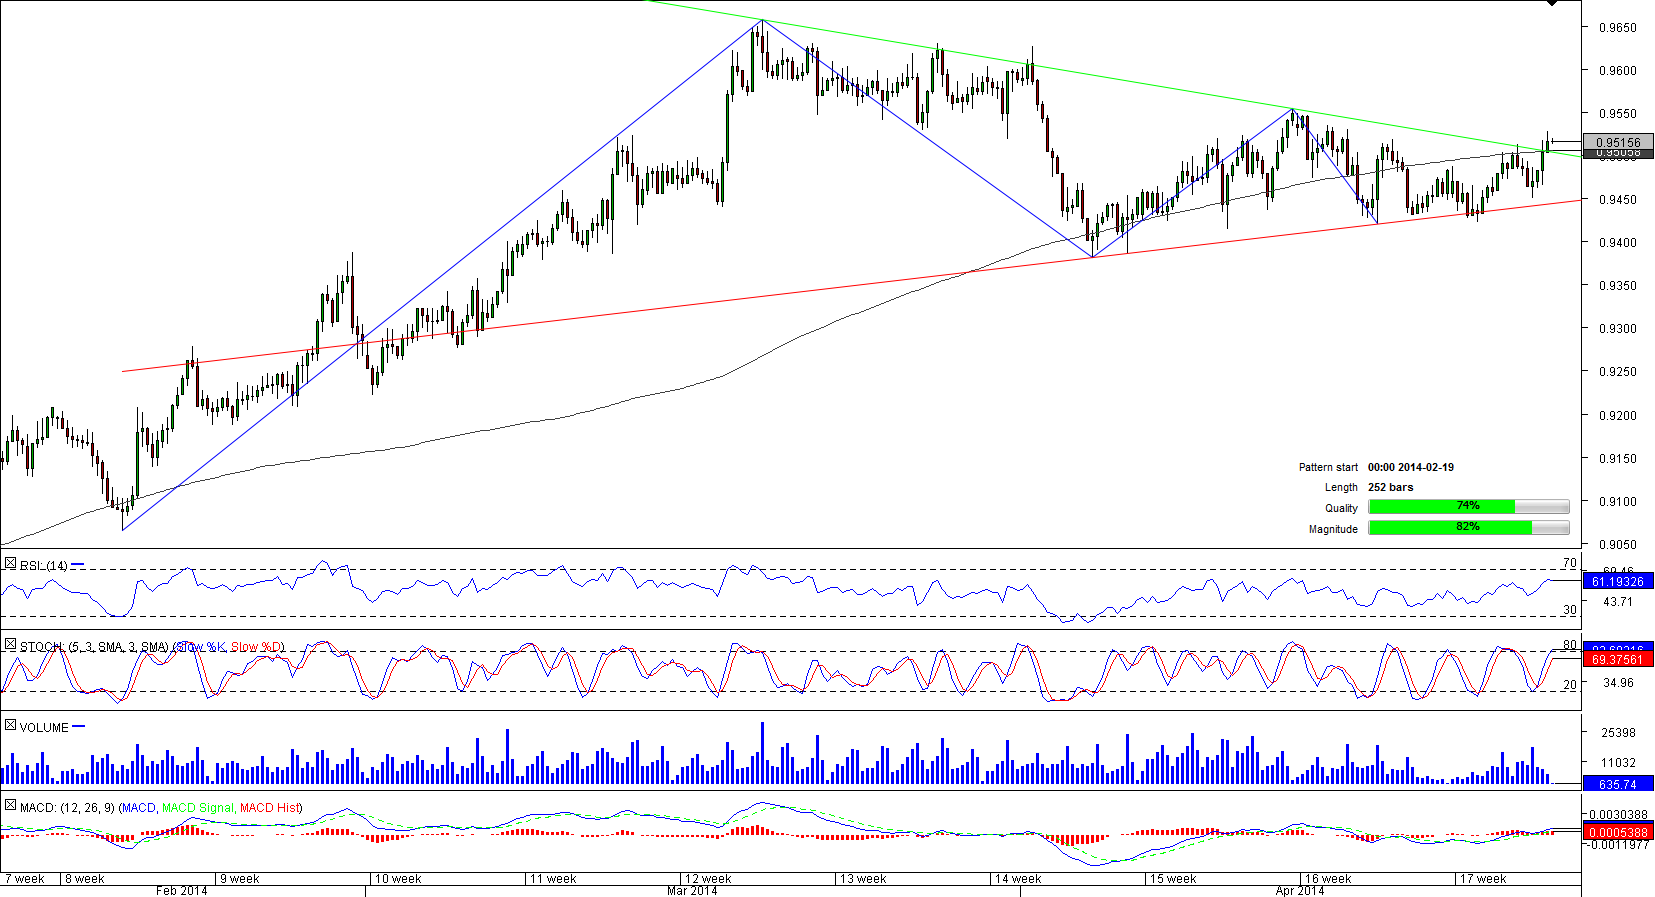
 NZD/CAD was locked between two gradually converging lines during more than two months ended April 24 when the pair broke through the upper limit of the 252-bar long triangle pattern.
Now is the right time to make some profit on the pair, as a bullish breakout from a triangle pattern usually leads to an accelerating advancement of the instrument. If these ideas come true, the pair may sequentially target three important resistance zones at 0.9528/9 (four-hour R1, daily R1), 0.9540/56 (four-hour R2, R3; daily R2) and 0.9595 (daily R3). In case the pair succeeds in overcoming these levels, a five-year high at 0.9661 will seem more attainable.

Thu, 24 Apr 2014 06:43:17 GMT
Source: Dukascopy Bank SA
© Dukascopy Bank SA
Now is the right time to make some profit on the pair, as a bullish breakout from a triangle pattern usually leads to an accelerating advancement of the instrument. If these ideas come true, the pair may sequentially target three important resistance zones at 0.9528/9 (four-hour R1, daily R1), 0.9540/56 (four-hour R2, R3; daily R2) and 0.9595 (daily R3). In case the pair succeeds in overcoming these levels, a five-year high at 0.9661 will seem more attainable.
© Dukascopy Bank SA
Actual Topics
Subscribe to "Fundamental Analysis" feed
Subscribe
Pre viac informácií o Dukascopy Bank CFD / Forex obchodných platformách a ostatných záležitostiach
nás prosím kontaktujte alebo požiadajte o hovor od nás.
nás prosím kontaktujte alebo požiadajte o hovor od nás.
For further information regarding potential cooperation,
please call us or make callback request.
please call us or make callback request.
To learn more about Dukascopy Bank Binary Options
/ Forex trading platform, SWFX and other trading related information,
please call us or make callback request.
please call us or make callback request.
Pre viac informácií o Dukascopy Bank CFD / Forex obchodných platformách a ostatných záležitostiach
nás prosím kontaktujte alebo požiadajte o hovor od nás.
nás prosím kontaktujte alebo požiadajte o hovor od nás.
To learn more about Crypto Trading / CFD / Forex trading platform, SWFX and other trading related information,
please call us or make callback request.
please call us or make callback request.
To learn more about Business Introducer and other trading related information,
please call us or make callback request.
please call us or make callback request.
For further information regarding potential cooperation,
please call us or make callback request.
please call us or make callback request.