Note: This section contains information in English only.
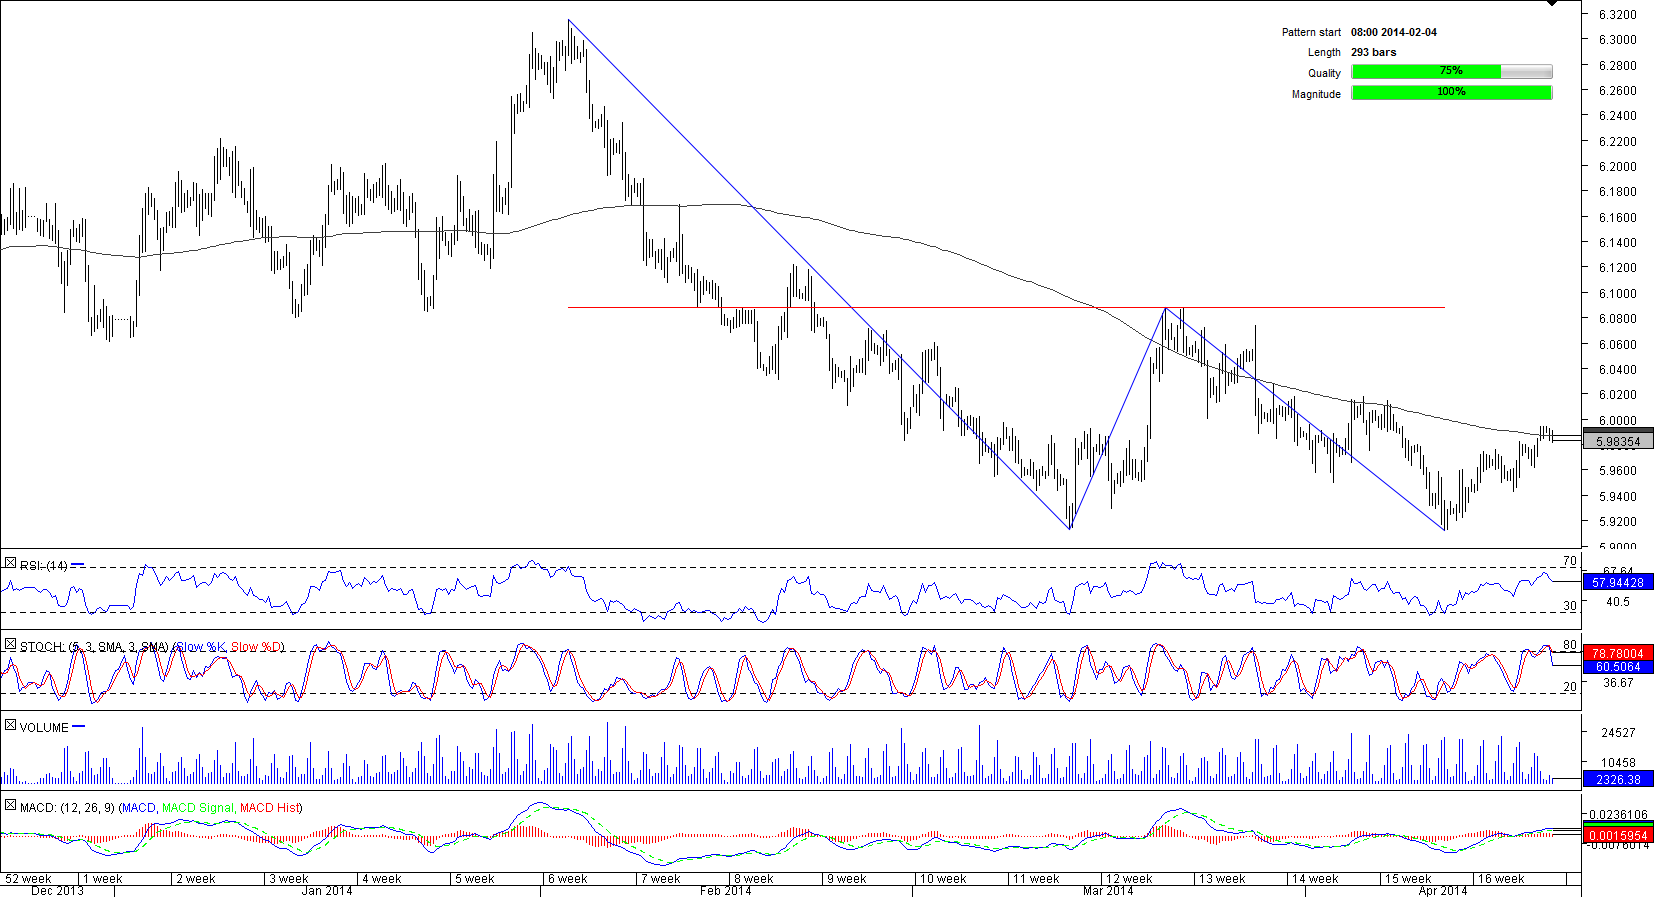
 After a massive sell-off that was observed between the first days of February and the middle of March USD/NOK encountered a tough support area near 5.90 that still remains intact. Accordingly, there is a significant probability of a double bottom emerging on the four-hour chart. Still, this would require the U.S. Dollar to breach the immediate obstacle at 6.00 and rise up to the key resistance at 6.0880. Then, if this level is breached, the rally will be able to extend up to 6.3150, the Feb 4 highs. And while the sentiment towards USD/NOK is fairly bullish— 68% of positions are long, the technical indicators are mostly pointing downwards, especially on the longer-term time-frames.

Fri, 18 Apr 2014 11:24:01 GMT
Source: Dukascopy Bank SA
© Dukascopy Bank SA
© Dukascopy Bank SA
Actual Topics
Subscribe to "Fundamental Analysis" feed
Subscribe
Pre viac informácií o Dukascopy Bank CFD / Forex obchodných platformách a ostatných záležitostiach
nás prosím kontaktujte alebo požiadajte o hovor od nás.
nás prosím kontaktujte alebo požiadajte o hovor od nás.
For further information regarding potential cooperation,
please call us or make callback request.
please call us or make callback request.
To learn more about Dukascopy Bank Binary Options
/ Forex trading platform, SWFX and other trading related information,
please call us or make callback request.
please call us or make callback request.
Pre viac informácií o Dukascopy Bank CFD / Forex obchodných platformách a ostatných záležitostiach
nás prosím kontaktujte alebo požiadajte o hovor od nás.
nás prosím kontaktujte alebo požiadajte o hovor od nás.
To learn more about Crypto Trading / CFD / Forex trading platform, SWFX and other trading related information,
please call us or make callback request.
please call us or make callback request.
To learn more about Business Introducer and other trading related information,
please call us or make callback request.
please call us or make callback request.
For further information regarding potential cooperation,
please call us or make callback request.
please call us or make callback request.