Note: This section contains information in English only.
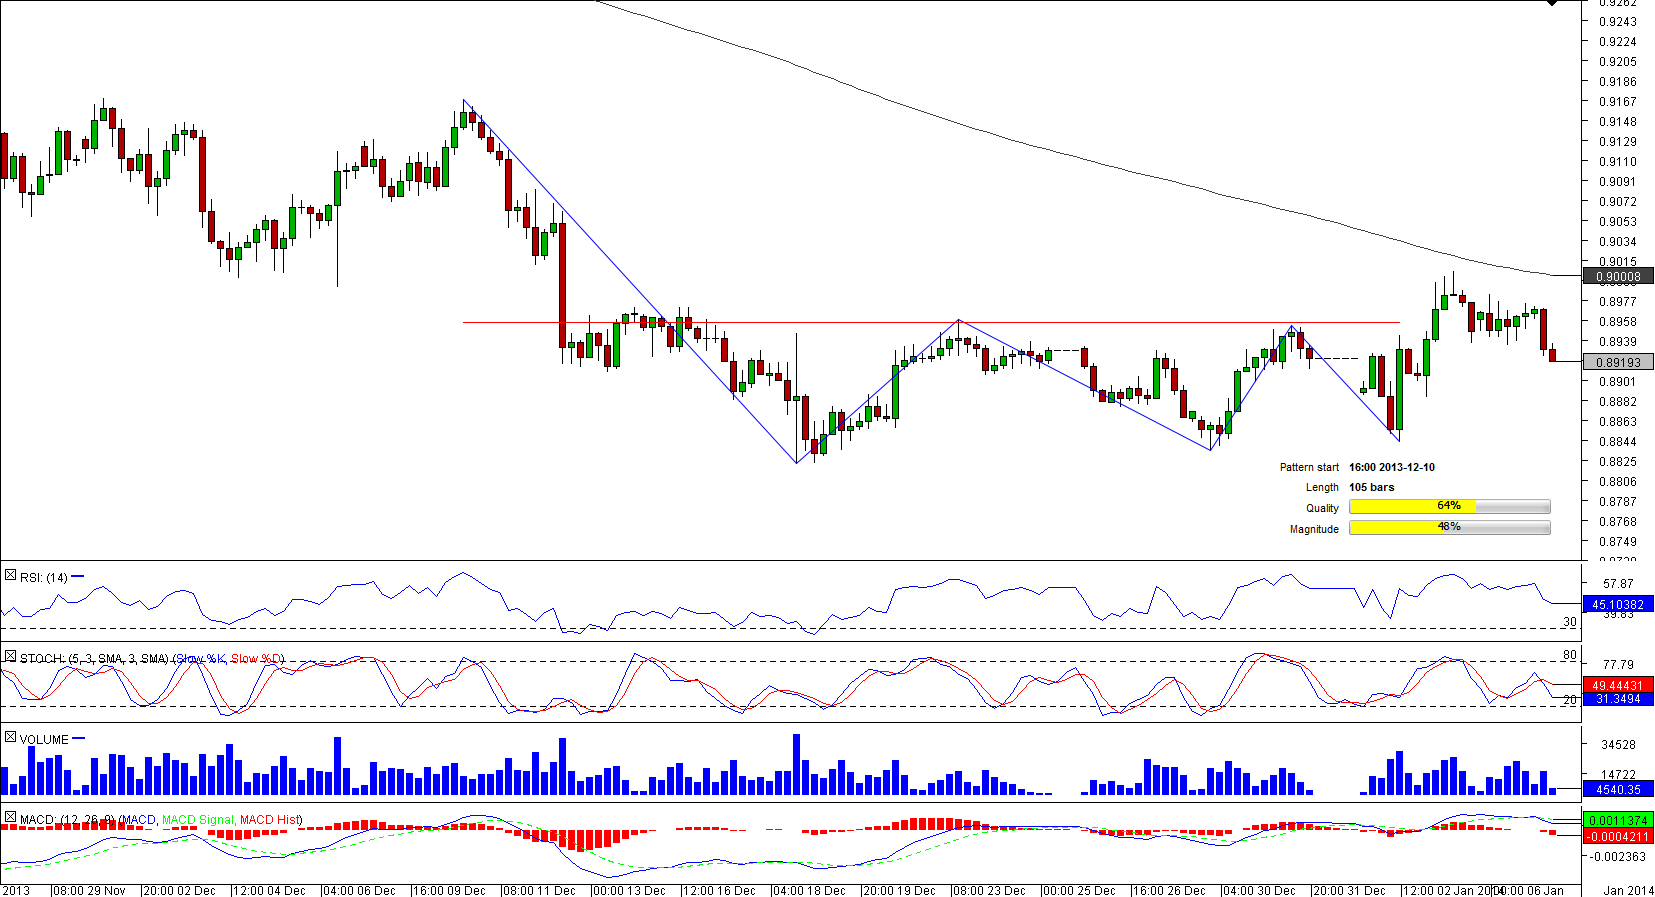
 The Australian Dollar has been losing ground against its U.S. peer since mid-October and in the first part of December the pair embarked on a formation of the triple bottom pattern that took the currency couple to a five-year low of 0.8821. AUD/USD neared this low for three times and now it entered the bullish phase of the pattern; in other words, it breached both the 50-bar SMA and pattern's resistance that was expected to provoke a sharp advance. However, the pair did not manage to sustain the fast pace of appreciation and was forced to come back to the 50-bar SMA, near which it is likely to trade in the hours to come.

Tue, 07 Jan 2014 06:53:04 GMT
Source: Dukascopy Bank SA
© Dukascopy Bank SA
© Dukascopy Bank SA
Actual Topics
Subscribe to "Fundamental Analysis" feed
Subscribe
Pre viac informácií o Dukascopy Bank CFD / Forex obchodných platformách a ostatných záležitostiach
nás prosím kontaktujte alebo požiadajte o hovor od nás.
nás prosím kontaktujte alebo požiadajte o hovor od nás.
For further information regarding potential cooperation,
please call us or make callback request.
please call us or make callback request.
To learn more about Dukascopy Bank Binary Options
/ Forex trading platform, SWFX and other trading related information,
please call us or make callback request.
please call us or make callback request.
Pre viac informácií o Dukascopy Bank CFD / Forex obchodných platformách a ostatných záležitostiach
nás prosím kontaktujte alebo požiadajte o hovor od nás.
nás prosím kontaktujte alebo požiadajte o hovor od nás.
To learn more about Crypto Trading / CFD / Forex trading platform, SWFX and other trading related information,
please call us or make callback request.
please call us or make callback request.
To learn more about Business Introducer and other trading related information,
please call us or make callback request.
please call us or make callback request.
For further information regarding potential cooperation,
please call us or make callback request.
please call us or make callback request.