Note: This section contains information in English only.
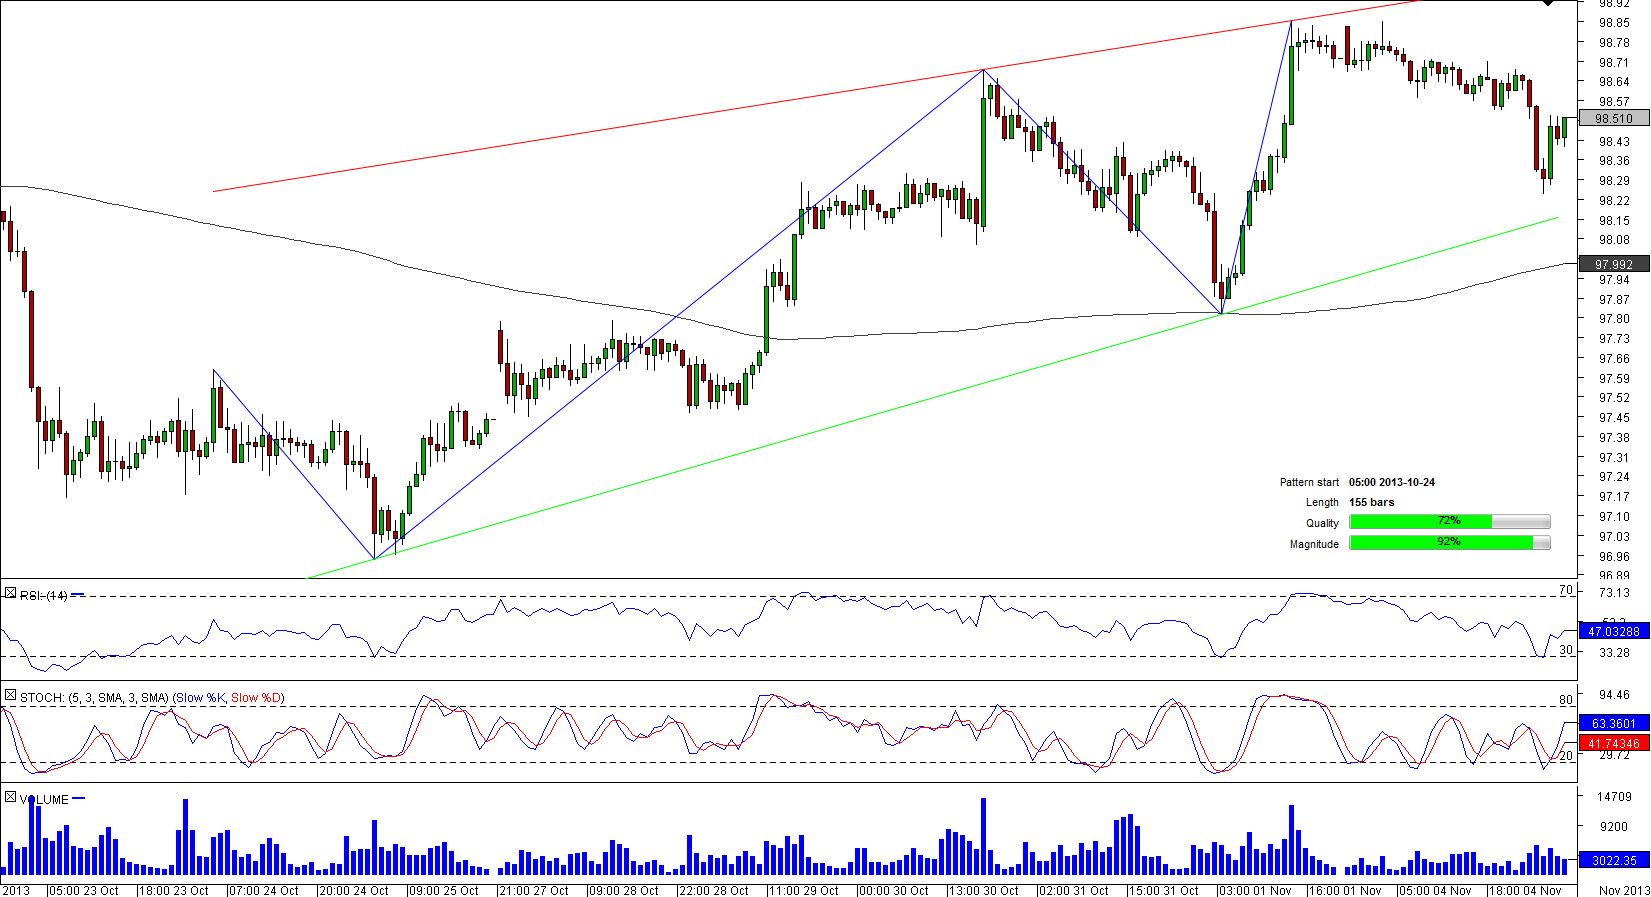
 A 195-hour long rising wedge pattern formed by USD/JPY started on October 22. Since then, the currency couple fluctuated between two upward sloping lines that helped USD/JPY to reach a two-week high on November 1. After coming off this high, the pair dived below 50-hour SMA to trade close to daily support sitting at 98.50 (daily S1). The SWFX data indicates that market participants are moderately bullish on the pair, with proportion of long positions being 69.49%. At the same time, technical indicators call for a drop in the short-term and a jump in medium-term suggesting that selling pressure is likely to continue playing its role for the next hour but may mollify in the hours to come.

Tue, 05 Nov 2013 07:24:29 GMT
Source: Dukascopy Bank SA
© Dukascopy Bank SA
© Dukascopy Bank SA
Actual Topics
Subscribe to "Fundamental Analysis" feed
Subscribe
Pre viac informácií o Dukascopy Bank CFD / Forex obchodných platformách a ostatných záležitostiach
nás prosím kontaktujte alebo požiadajte o hovor od nás.
nás prosím kontaktujte alebo požiadajte o hovor od nás.
For further information regarding potential cooperation,
please call us or make callback request.
please call us or make callback request.
To learn more about Dukascopy Bank Binary Options
/ Forex trading platform, SWFX and other trading related information,
please call us or make callback request.
please call us or make callback request.
Pre viac informácií o Dukascopy Bank CFD / Forex obchodných platformách a ostatných záležitostiach
nás prosím kontaktujte alebo požiadajte o hovor od nás.
nás prosím kontaktujte alebo požiadajte o hovor od nás.
To learn more about Crypto Trading / CFD / Forex trading platform, SWFX and other trading related information,
please call us or make callback request.
please call us or make callback request.
To learn more about Business Introducer and other trading related information,
please call us or make callback request.
please call us or make callback request.
For further information regarding potential cooperation,
please call us or make callback request.
please call us or make callback request.