Currently, the pair is trading above its 200-hour SMA that is at the mark of 10.3472. Technical indicators suggest that a decline is likely. A drop below the 200-hour SMA that now acts as a strong support may send the pair to 10.3138 (daily S2) and, if overcome, the level of 10.2861 (daily S3)
Note: This section contains information in English only.
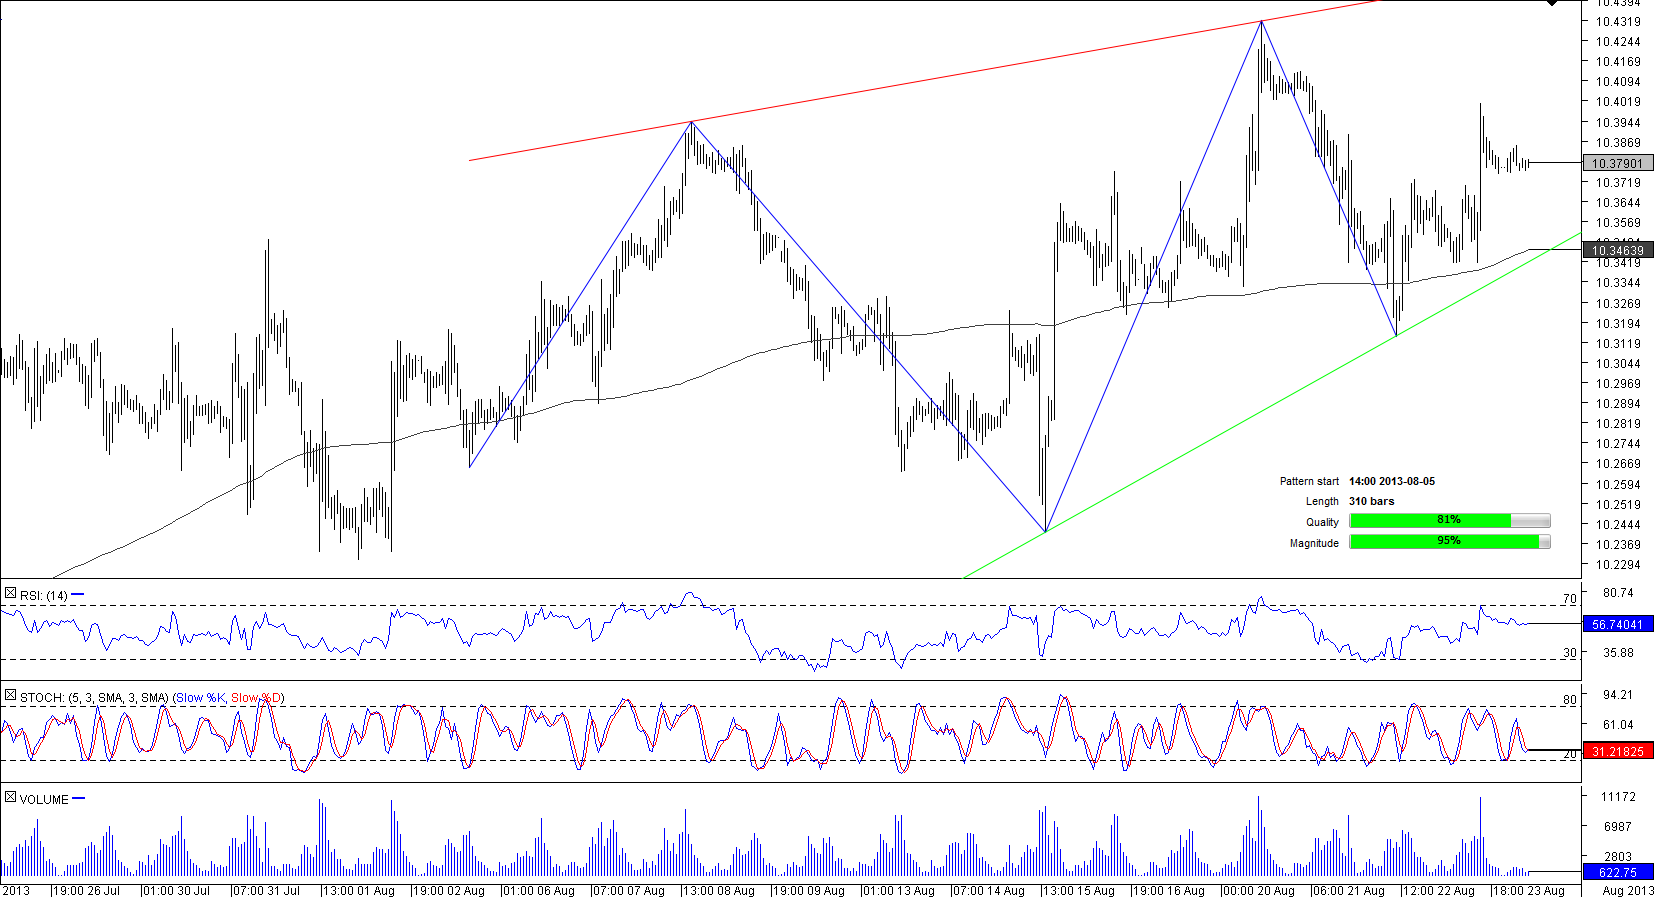
 After attaining the pattern's resistance that was at 10.3932, EUR/HKD reversed its direction to the south, diving below its 200-hour SMA. However, the pair bounced off the pattern's support and was rising until it touched a six-month high of 10.4311. A rise to this level triggered a sell-off towards its 200-hour SMA.
Currently, the pair is trading above its 200-hour SMA that is at the mark of 10.3472. Technical indicators suggest that a decline is likely. A drop below the 200-hour SMA that now acts as a strong support may send the pair to 10.3138 (daily S2) and, if overcome, the level of 10.2861 (daily S3)

Mon, 26 Aug 2013 08:04:21 GMT
Source: Dukascopy Bank SA
© Dukascopy Bank SA
Currently, the pair is trading above its 200-hour SMA that is at the mark of 10.3472. Technical indicators suggest that a decline is likely. A drop below the 200-hour SMA that now acts as a strong support may send the pair to 10.3138 (daily S2) and, if overcome, the level of 10.2861 (daily S3)
© Dukascopy Bank SA
Actual Topics
Subscribe to "Fundamental Analysis" feed
Subscribe
Pre viac informácií o Dukascopy Bank CFD / Forex obchodných platformách a ostatných záležitostiach
nás prosím kontaktujte alebo požiadajte o hovor od nás.
nás prosím kontaktujte alebo požiadajte o hovor od nás.
For further information regarding potential cooperation,
please call us or make callback request.
please call us or make callback request.
To learn more about Dukascopy Bank Binary Options
/ Forex trading platform, SWFX and other trading related information,
please call us or make callback request.
please call us or make callback request.
Pre viac informácií o Dukascopy Bank CFD / Forex obchodných platformách a ostatných záležitostiach
nás prosím kontaktujte alebo požiadajte o hovor od nás.
nás prosím kontaktujte alebo požiadajte o hovor od nás.
To learn more about Crypto Trading / CFD / Forex trading platform, SWFX and other trading related information,
please call us or make callback request.
please call us or make callback request.
To learn more about Business Introducer and other trading related information,
please call us or make callback request.
please call us or make callback request.
For further information regarding potential cooperation,
please call us or make callback request.
please call us or make callback request.