Technical indicators on 1D time horizon send a sell signal suggesting that pair might demonstrate a short term bearish dip before picking up again. Short traders could focus on weekly pivot (R2)/daily pivot (S1)/20 bar SMA at 0.8028/25, daily pivot (S2) at 0.8011, daily pivot (S3)/Bollinger band at 0.7999/96 and 20 bar SMA/pattern's support/Fibonacci retracement (61.8% of move since 29th of June) at 0.7974/67.
Note: This section contains information in English only.
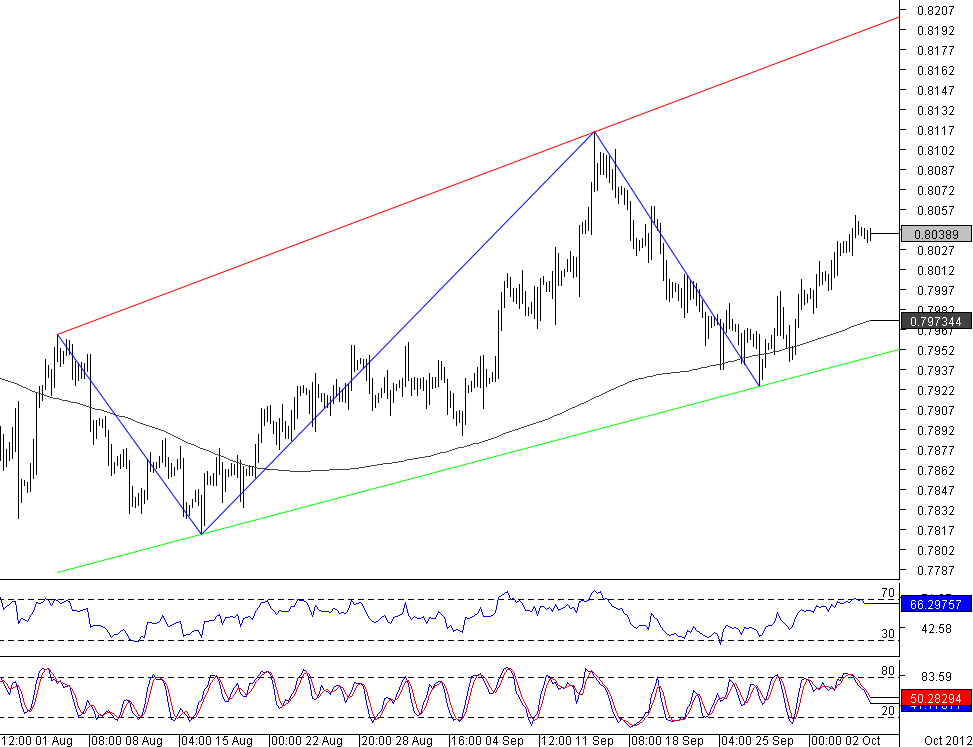
 EUR/GBP has formed an Ascending Broadening Wedge pattern on 4H chart. The pattern has 46% quality and 84% magnitude in the 235-bar period.
Technical indicators on 1D time horizon send a sell signal suggesting that pair might demonstrate a short term bearish dip before picking up again. Short traders could focus on weekly pivot (R2)/daily pivot (S1)/20 bar SMA at 0.8028/25, daily pivot (S2) at 0.8011, daily pivot (S3)/Bollinger band at 0.7999/96 and 20 bar SMA/pattern's support/Fibonacci retracement (61.8% of move since 29th of June) at 0.7974/67.

Fri, 05 Oct 2012 13:03:03 GMT
Source: Dukascopy Bank SA
© Dukascopy Bank SA
The pattern started when the pair rebounded from 0.7964; currently it is trading at 0.8039. Gap between pattern's support and resistance broadens by 25 pips in 100 pips period. Technical indicators on aggregate point at appreciation of the pair on 4H and 1W horizons suggesting that pair will continue to move towards pattern's resistance and will follow pattern's, upward sloping, trend. Long traders could focus on daily pivot (PP) at 0.8040, Bollinger band/daily pivot (R1)/weekly pivot (R3) at 0.8058/60, daily pivot (R2) at 0.8070 and daily pivot/26th of June high at 0.8087/95.
Technical indicators on 1D time horizon send a sell signal suggesting that pair might demonstrate a short term bearish dip before picking up again. Short traders could focus on weekly pivot (R2)/daily pivot (S1)/20 bar SMA at 0.8028/25, daily pivot (S2) at 0.8011, daily pivot (S3)/Bollinger band at 0.7999/96 and 20 bar SMA/pattern's support/Fibonacci retracement (61.8% of move since 29th of June) at 0.7974/67.
© Dukascopy Bank SA
Actual Topics
Subscribe to "Fundamental Analysis" feed
Subscribe
Pre viac informácií o Dukascopy Bank CFD / Forex obchodných platformách a ostatných záležitostiach
nás prosím kontaktujte alebo požiadajte o hovor od nás.
nás prosím kontaktujte alebo požiadajte o hovor od nás.
For further information regarding potential cooperation,
please call us or make callback request.
please call us or make callback request.
To learn more about Dukascopy Bank Binary Options
/ Forex trading platform, SWFX and other trading related information,
please call us or make callback request.
please call us or make callback request.
Pre viac informácií o Dukascopy Bank CFD / Forex obchodných platformách a ostatných záležitostiach
nás prosím kontaktujte alebo požiadajte o hovor od nás.
nás prosím kontaktujte alebo požiadajte o hovor od nás.
To learn more about Crypto Trading / CFD / Forex trading platform, SWFX and other trading related information,
please call us or make callback request.
please call us or make callback request.
To learn more about Business Introducer and other trading related information,
please call us or make callback request.
please call us or make callback request.
For further information regarding potential cooperation,
please call us or make callback request.
please call us or make callback request.