Note: This section contains information in English only.
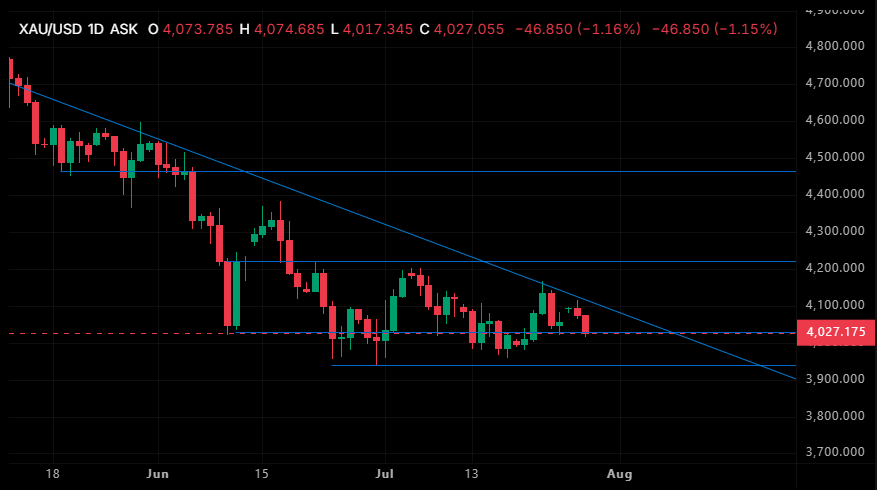
The daily chart for XAU/USD presents a clear bearish bias within a descending triangle pattern, characterized by a series of lower highs bounded by dynamic trendline resistance and a flat horizontal support zone. Trading right at $4,027 after a recent -1.16% drop, the price is testing immediate support at $4,017; a decisive daily close below this pivot confirms downside momentum toward major support near $3,920, with further breakdown targets extending toward $3,850. Conversely, for bulls to invalidate this downtrend, price must break and hold above the upper trendline near $4,120, which would shift short-term momentum toward higher resistance targets at $4,220 and $4,460.
Tue, 28 Jul 2026 11:25:04 GMT
Source: Dukascopy Bank SA
Actual Topics
Pre viac informácií o Dukascopy Bank CFD / Forex obchodných platformách a ostatných záležitostiach
nás prosím kontaktujte alebo požiadajte o hovor od nás.
nás prosím kontaktujte alebo požiadajte o hovor od nás.
For further information regarding potential cooperation,
please call us or make callback request.
please call us or make callback request.
To learn more about Dukascopy Bank Binary Options
/ Forex trading platform, SWFX and other trading related information,
please call us or make callback request.
please call us or make callback request.
Pre viac informácií o Dukascopy Bank CFD / Forex obchodných platformách a ostatných záležitostiach
nás prosím kontaktujte alebo požiadajte o hovor od nás.
nás prosím kontaktujte alebo požiadajte o hovor od nás.
To learn more about Crypto Trading / CFD / Forex trading platform, SWFX and other trading related information,
please call us or make callback request.
please call us or make callback request.
To learn more about Business Introducer and other trading related information,
please call us or make callback request.
please call us or make callback request.
For further information regarding potential cooperation,
please call us or make callback request.
please call us or make callback request.