Currently the yellow metal is vacillating in the relatively narrow trading range, meaning that triangle apex is approaching. The overall picture looks bullish for the most traded precious metal as over 72% of market players hold long positions. However, to materialize this outlook, the metal has to penetrate formidable resistance at 1,246.07 (50-hour SMA, daily pivot point) and then it may target the level of 1,247.58/9.17 that is the last defence from a bullish breakout.
Note: This section contains information in English only.
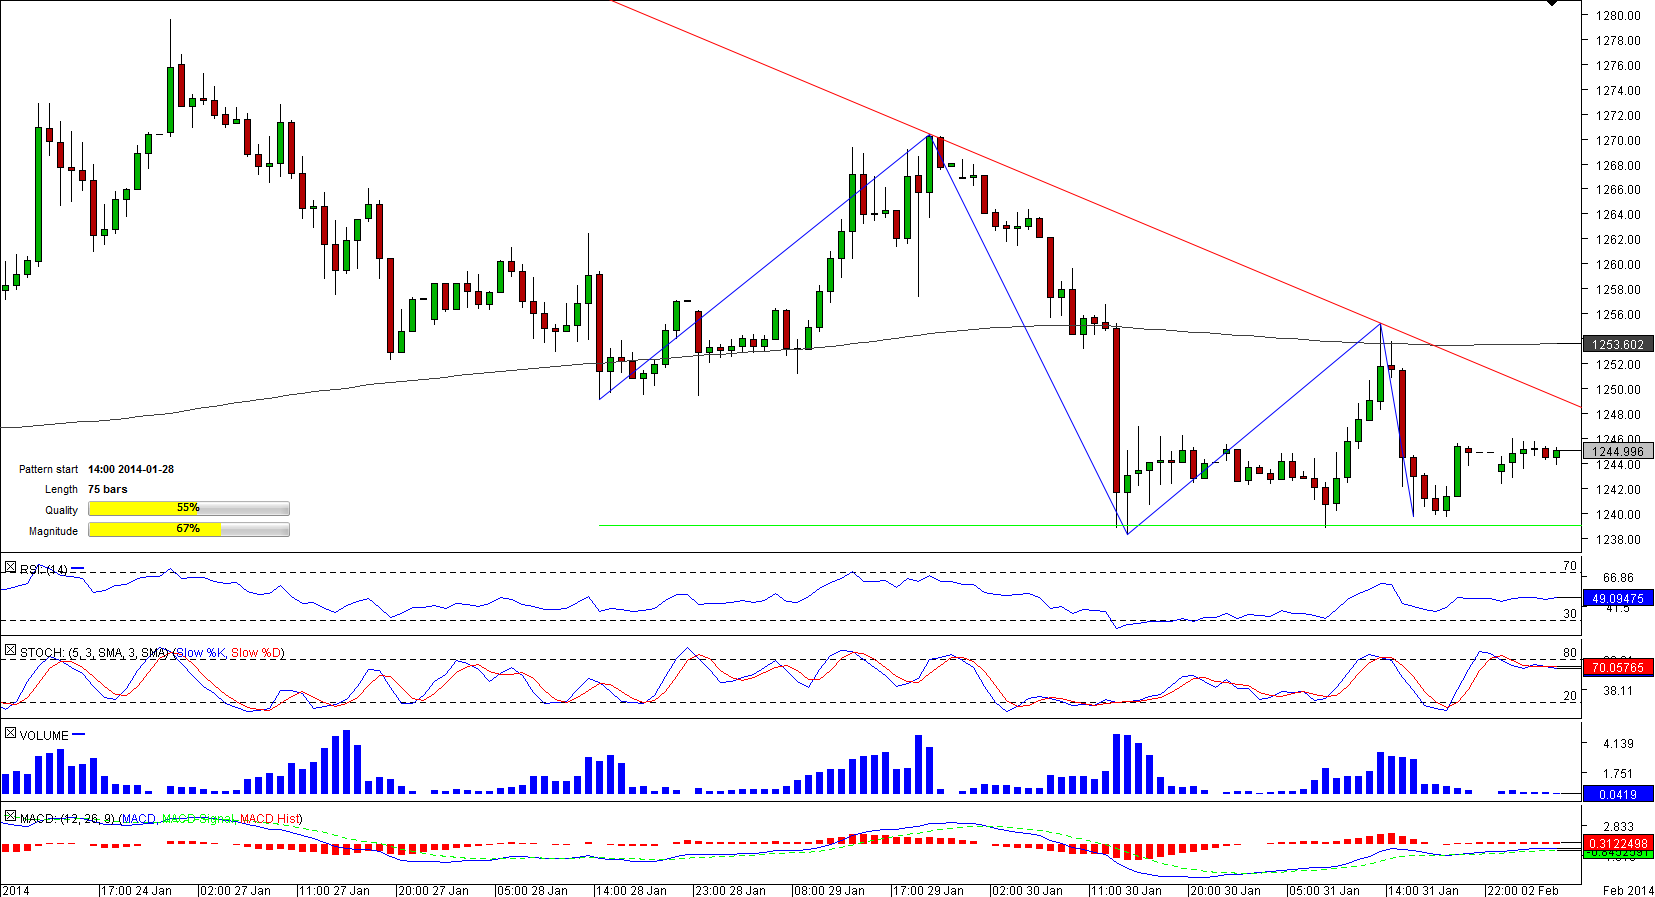
 Having hit a two-month high of $1,279.62 per ounce on January 26, XAU/USD started to shape a descending triangle pattern.
Currently the yellow metal is vacillating in the relatively narrow trading range, meaning that triangle apex is approaching. The overall picture looks bullish for the most traded precious metal as over 72% of market players hold long positions. However, to materialize this outlook, the metal has to penetrate formidable resistance at 1,246.07 (50-hour SMA, daily pivot point) and then it may target the level of 1,247.58/9.17 that is the last defence from a bullish breakout.

Mon, 03 Feb 2014 06:58:24 GMT
Source: Dukascopy Bank SA
© Dukascopy Bank SA
Currently the yellow metal is vacillating in the relatively narrow trading range, meaning that triangle apex is approaching. The overall picture looks bullish for the most traded precious metal as over 72% of market players hold long positions. However, to materialize this outlook, the metal has to penetrate formidable resistance at 1,246.07 (50-hour SMA, daily pivot point) and then it may target the level of 1,247.58/9.17 that is the last defence from a bullish breakout.
© Dukascopy Bank SA
Actual Topics
Subscribe to "Fundamental Analysis" feed
Subscribe
Aby dowiedzieć się więcej o handlu Forex/CFD na platformie Dukascopy Banku, rynku SWFX oraz innych rzeczy związanych z handlem,
zadzwoń do nas lub poproś o oddzwonienie.
zadzwoń do nas lub poproś o oddzwonienie.
For further information regarding potential cooperation,
please call us or make callback request.
please call us or make callback request.
Aby dowiedzieć się więcej o Opcjach Binarnych w Banku Dukascopy / platformach handlowych Forex, SWFX, oraz innych,
zadzwoń do nas lub pozostaw prośbę o oddzwonienie.
zadzwoń do nas lub pozostaw prośbę o oddzwonienie.
Aby dowiedzieć się więcej o handlu Forex/CFD na platformie Dukascopy Banku, rynku SWFX oraz innych rzeczy związanych z handlem,
zadzwoń do nas lub poproś o oddzwonienie.
zadzwoń do nas lub poproś o oddzwonienie.
To learn more about Crypto Trading / CFD / Forex trading platform, SWFX and other trading related information,
please call us or make callback request.
please call us or make callback request.
To learn more about Business Introducer and other trading related information,
please call us or make callback request.
please call us or make callback request.
For further information regarding potential cooperation,
please call us or make callback request.
please call us or make callback request.