Note: This section contains information in English only.
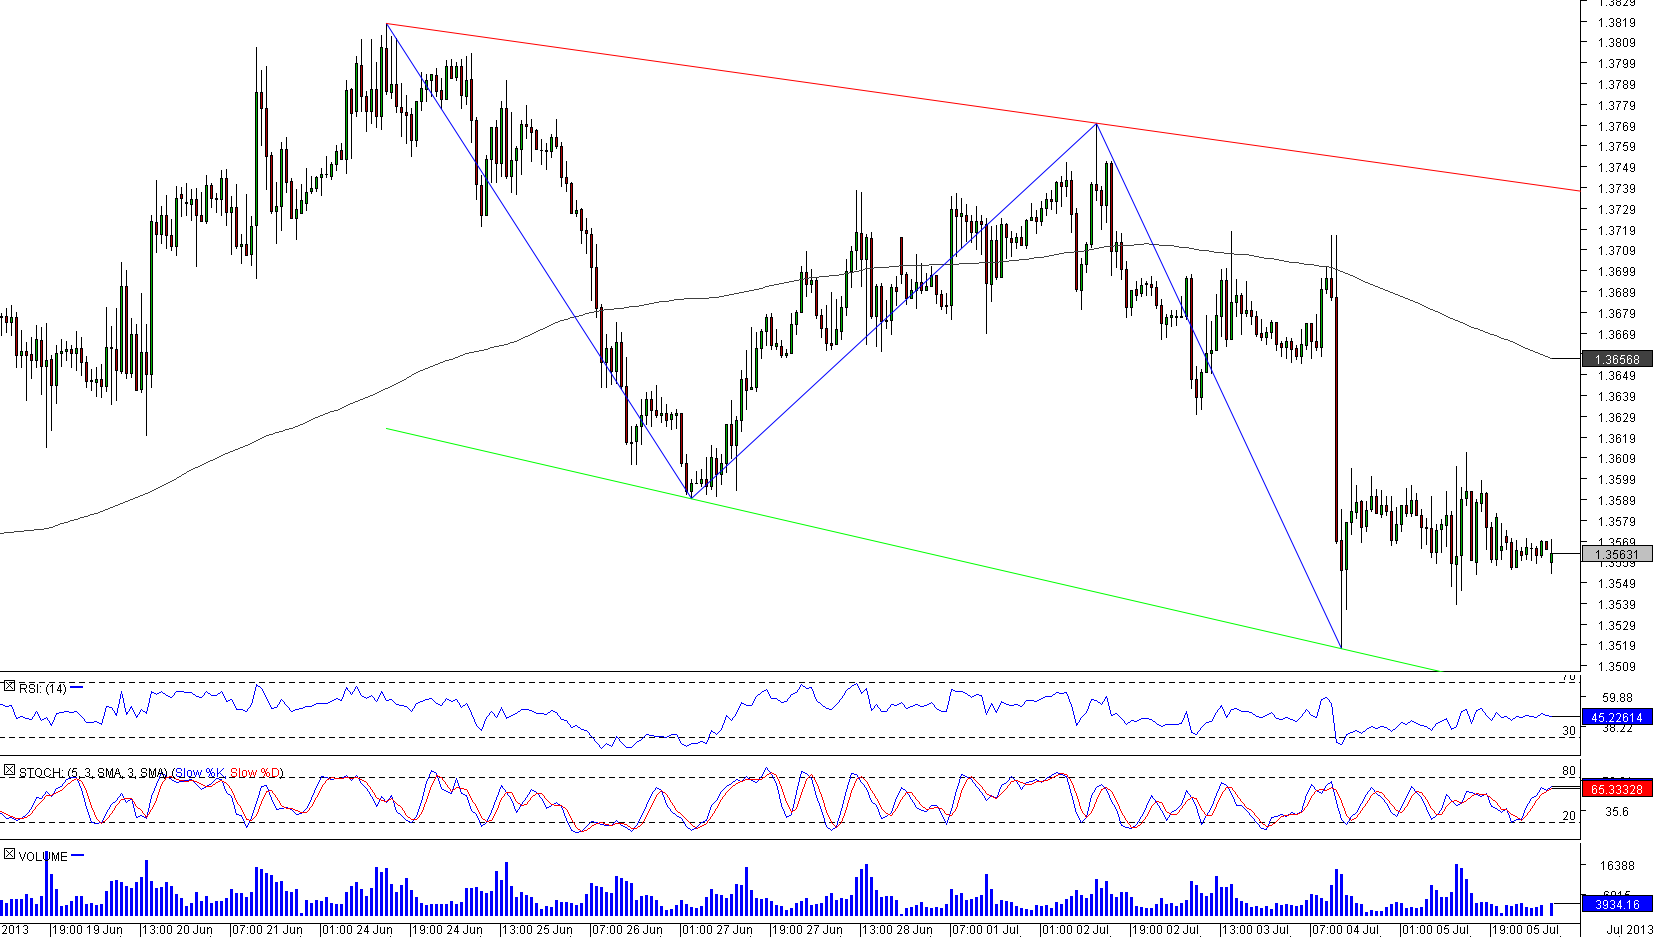
 Pair's Channel Down pattern has been developing rather nicely. However, we can see some turbulence in the recent trading activity which might cause some confusion and pair might trade sideways for some time. In any case, we think that pair is likely to continue to develop in the ranks of the pattern and start appreciating towards the pattern's resistance. Such turn of events is dictated by the Stochastic indicator on the daily chart. In the short and medium term pair might hover lower.

Mon, 08 Jul 2013 08:29:36 GMT
Source: Dukascopy Bank SA
© Dukascopy Bank SA
© Dukascopy Bank SA
Actual Topics
Subscribe to "Fundamental Analysis" feed
Subscribe
Aby dowiedzieć się więcej o handlu Forex/CFD na platformie Dukascopy Banku, rynku SWFX oraz innych rzeczy związanych z handlem,
zadzwoń do nas lub poproś o oddzwonienie.
zadzwoń do nas lub poproś o oddzwonienie.
For further information regarding potential cooperation,
please call us or make callback request.
please call us or make callback request.
Aby dowiedzieć się więcej o Opcjach Binarnych w Banku Dukascopy / platformach handlowych Forex, SWFX, oraz innych,
zadzwoń do nas lub pozostaw prośbę o oddzwonienie.
zadzwoń do nas lub pozostaw prośbę o oddzwonienie.
Aby dowiedzieć się więcej o handlu Forex/CFD na platformie Dukascopy Banku, rynku SWFX oraz innych rzeczy związanych z handlem,
zadzwoń do nas lub poproś o oddzwonienie.
zadzwoń do nas lub poproś o oddzwonienie.
To learn more about Crypto Trading / CFD / Forex trading platform, SWFX and other trading related information,
please call us or make callback request.
please call us or make callback request.
To learn more about Business Introducer and other trading related information,
please call us or make callback request.
please call us or make callback request.
For further information regarding potential cooperation,
please call us or make callback request.
please call us or make callback request.