Note: This section contains information in English only.
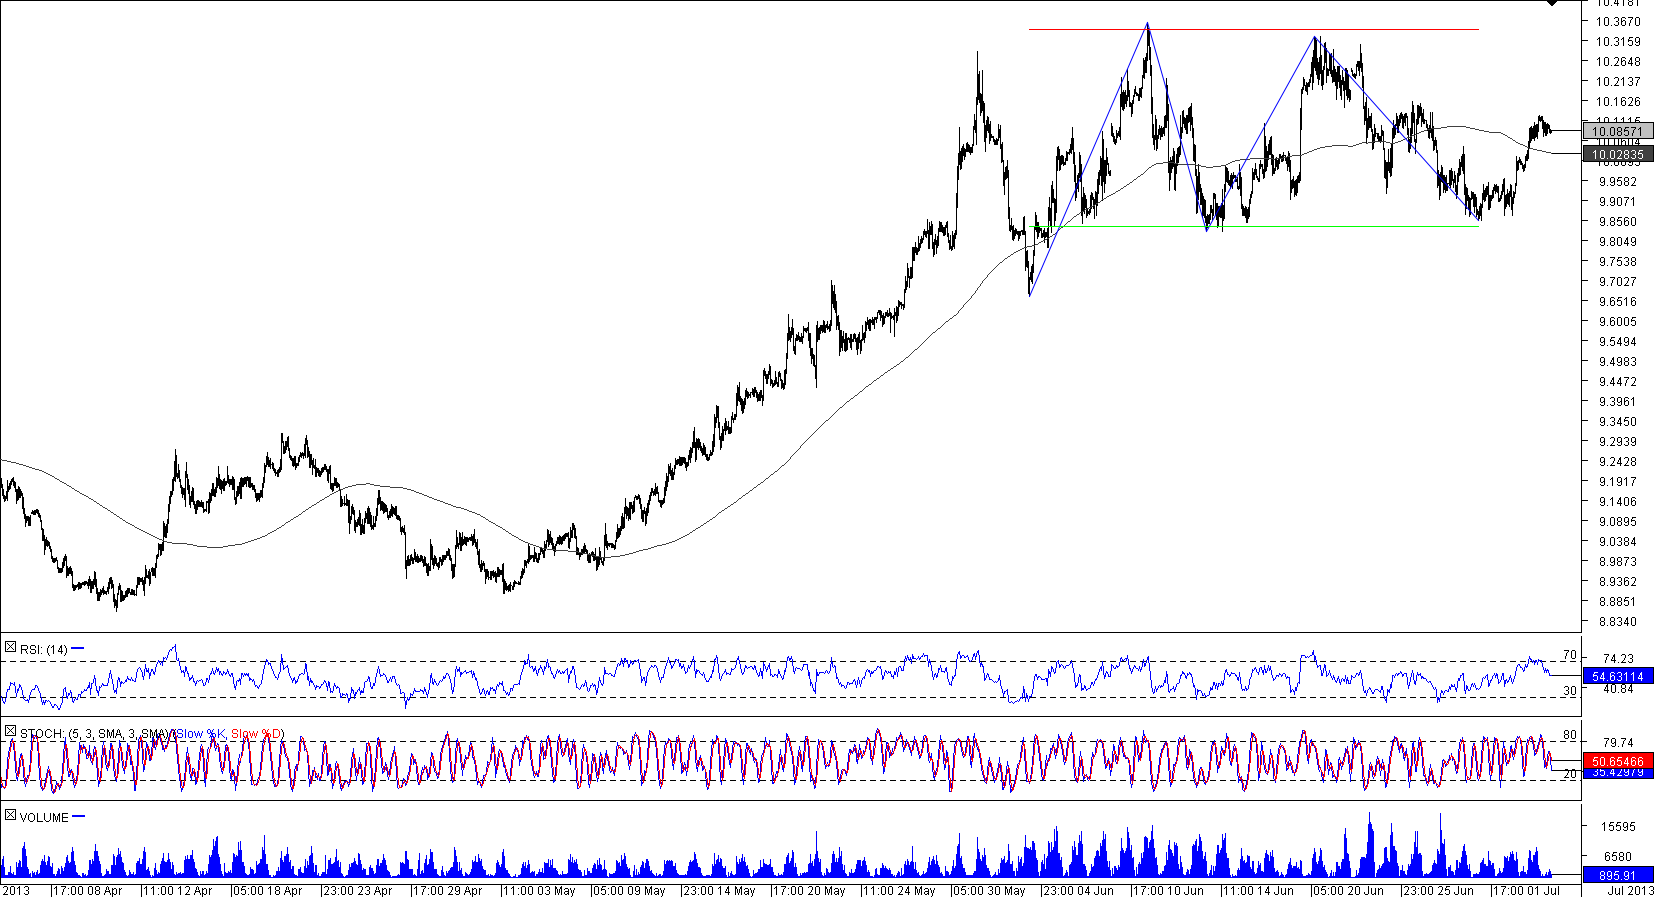
 USD/ZAR's rally from 8.91 was stopped by a tough resistance area at 10.3447, but a sell-off that ensued was in turn limited by a formidable support line at 9.8418. Since then (450 hours ago) these two levels have been keeping the currency pair within a horizontal corridor, i.e. in a rectangle. This implies that eventually the U.S. Dollar should recommence its advancement, meaning that the support will likely remain intact, while the resistance will not be able to contain the price for long, also being that technical indicators on 4H and daily charts are bullish.

Thu, 04 Jul 2013 07:26:14 GMT
Source: Dukascopy Bank SA
© Dukascopy Bank SA
© Dukascopy Bank SA
Actual Topics
Subscribe to "Fundamental Analysis" feed
Subscribe
Aby dowiedzieć się więcej o handlu Forex/CFD na platformie Dukascopy Banku, rynku SWFX oraz innych rzeczy związanych z handlem,
zadzwoń do nas lub poproś o oddzwonienie.
zadzwoń do nas lub poproś o oddzwonienie.
For further information regarding potential cooperation,
please call us or make callback request.
please call us or make callback request.
Aby dowiedzieć się więcej o Opcjach Binarnych w Banku Dukascopy / platformach handlowych Forex, SWFX, oraz innych,
zadzwoń do nas lub pozostaw prośbę o oddzwonienie.
zadzwoń do nas lub pozostaw prośbę o oddzwonienie.
Aby dowiedzieć się więcej o handlu Forex/CFD na platformie Dukascopy Banku, rynku SWFX oraz innych rzeczy związanych z handlem,
zadzwoń do nas lub poproś o oddzwonienie.
zadzwoń do nas lub poproś o oddzwonienie.
To learn more about Crypto Trading / CFD / Forex trading platform, SWFX and other trading related information,
please call us or make callback request.
please call us or make callback request.
To learn more about Business Introducer and other trading related information,
please call us or make callback request.
please call us or make callback request.
For further information regarding potential cooperation,
please call us or make callback request.
please call us or make callback request.