Note: This section contains information in English only.


Mon, 01 Jul 2013 13:58:27 GMT
Source: Dukascopy Bank SA
© Dukascopy Bank SA
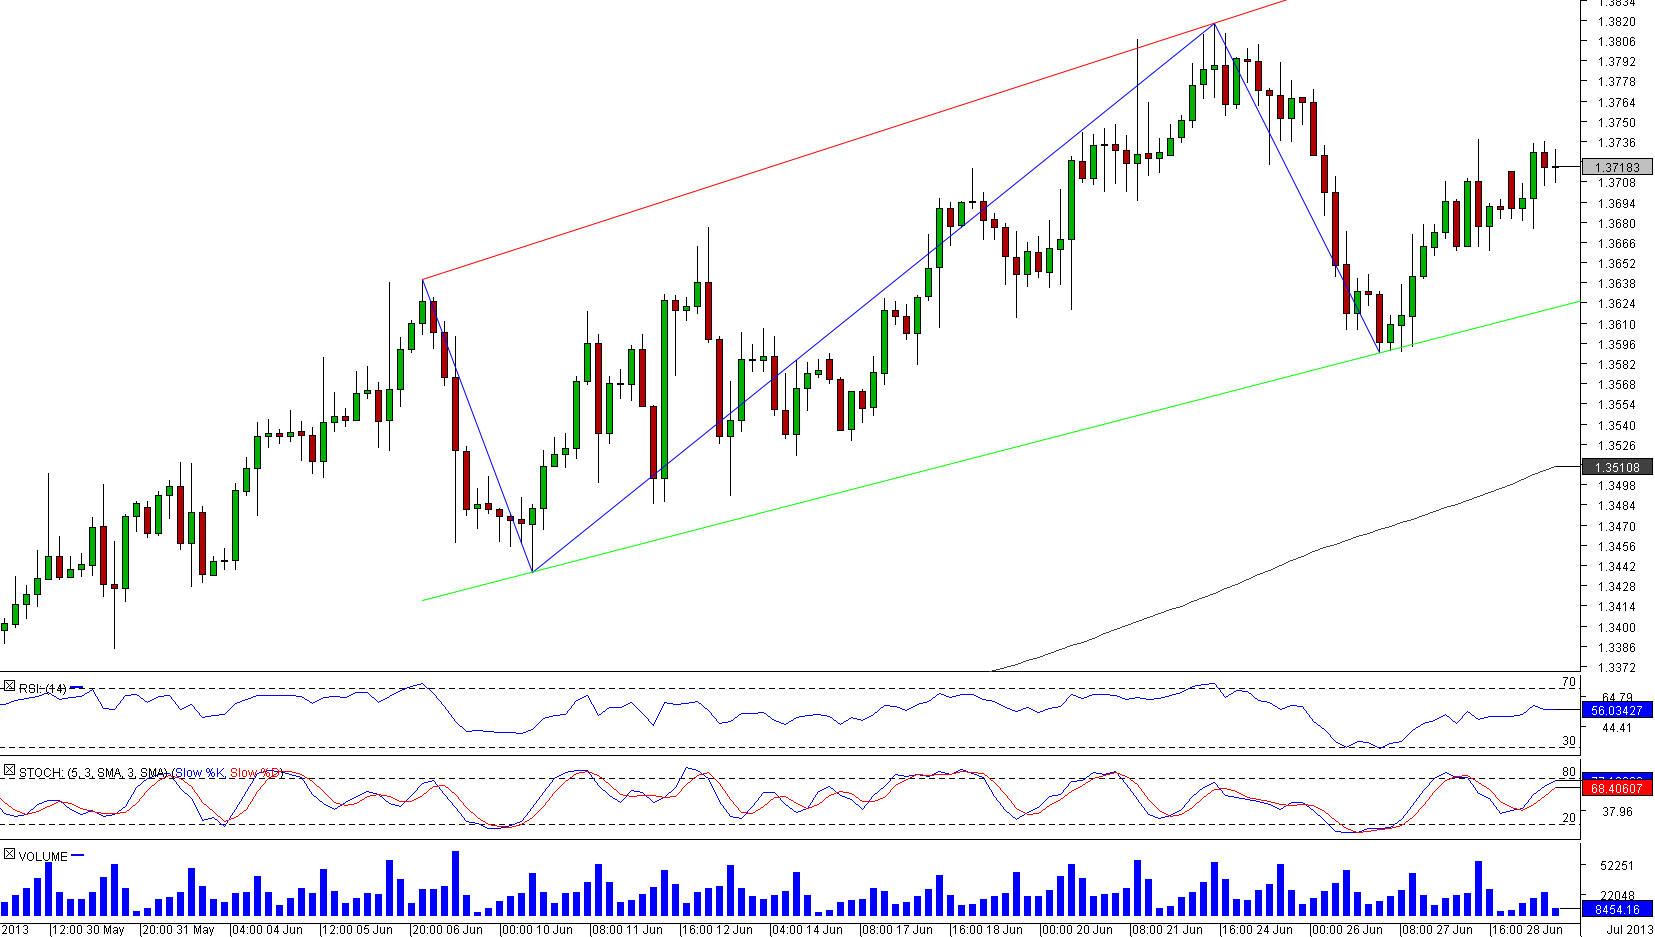
Pair started with a rather noisy trading period which significantly lowered its quality rating (56%) and in a sense artificially imploded magnitude (50%). However, we can see that pair is developing rather neatly in the ranks of the pattern and higher return could be expected from planned movement towards the pattern's resistance rather than from unexpected rallies. Expectations of a neat movement towards the pattern's resistance are strengthened by the aggregate reading from short and medium term indicators and with the fact that 24th to 27th of May sell off seems to be just a bearish correction.
© Dukascopy Bank SA
Actual Topics
Subscribe to "Fundamental Analysis" feed
Subscribe
Aby dowiedzieć się więcej o handlu Forex/CFD na platformie Dukascopy Banku, rynku SWFX oraz innych rzeczy związanych z handlem,
zadzwoń do nas lub poproś o oddzwonienie.
zadzwoń do nas lub poproś o oddzwonienie.
For further information regarding potential cooperation,
please call us or make callback request.
please call us or make callback request.
Aby dowiedzieć się więcej o Opcjach Binarnych w Banku Dukascopy / platformach handlowych Forex, SWFX, oraz innych,
zadzwoń do nas lub pozostaw prośbę o oddzwonienie.
zadzwoń do nas lub pozostaw prośbę o oddzwonienie.
Aby dowiedzieć się więcej o handlu Forex/CFD na platformie Dukascopy Banku, rynku SWFX oraz innych rzeczy związanych z handlem,
zadzwoń do nas lub poproś o oddzwonienie.
zadzwoń do nas lub poproś o oddzwonienie.
To learn more about Crypto Trading / CFD / Forex trading platform, SWFX and other trading related information,
please call us or make callback request.
please call us or make callback request.
To learn more about Business Introducer and other trading related information,
please call us or make callback request.
please call us or make callback request.
For further information regarding potential cooperation,
please call us or make callback request.
please call us or make callback request.