A decisive daily close above the descending trendline at 84.00–85.00 would confirm a bullish breakout, clearing the way toward targets at 93.00 and the 105.00–110.00 zone. Conversely, a breakdown below the 60 SMA and the ascending trendline at 75.00 would signal continued bearish momentum, shifting downside focus back toward the multi-month support floor at 67.00.
Note: This section contains information in English only.
The chart displays a multi-month symmetrical triangle consolidation pattern, bounded by a descending resistance trendline from the March peak near $120 and an ascending support trendline originating from the February base around 62. The price is currently trading at 82.105, hovering just above the flattened 60-day SMA following a rebound from a late-June double bottom near 67.00. This compression toward the narrowing apex reflects declining volatility and indicates an impending directional breakout.
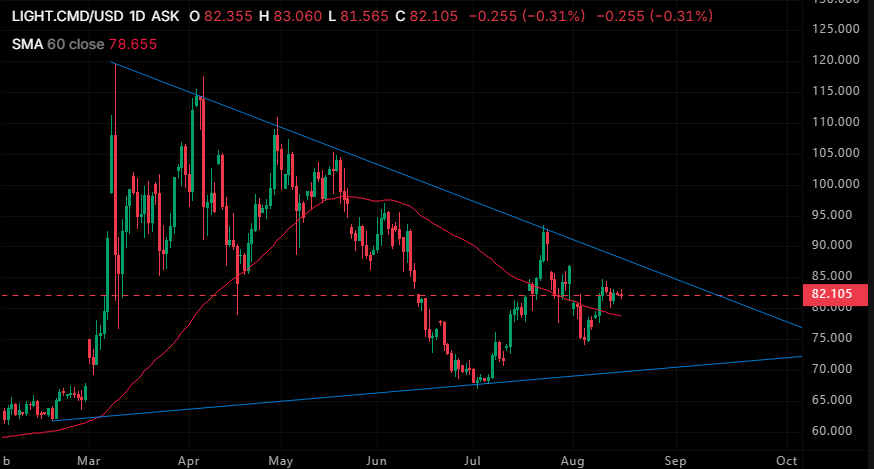
A decisive daily close above the descending trendline at 84.00–85.00 would confirm a bullish breakout, clearing the way toward targets at 93.00 and the 105.00–110.00 zone. Conversely, a breakdown below the 60 SMA and the ascending trendline at 75.00 would signal continued bearish momentum, shifting downside focus back toward the multi-month support floor at 67.00.
Mon, 17 Aug 2026 08:28:59 GMT
Source: Dukascopy Bank SA
A decisive daily close above the descending trendline at 84.00–85.00 would confirm a bullish breakout, clearing the way toward targets at 93.00 and the 105.00–110.00 zone. Conversely, a breakdown below the 60 SMA and the ascending trendline at 75.00 would signal continued bearish momentum, shifting downside focus back toward the multi-month support floor at 67.00.
Actual Topics
Aby dowiedzieć się więcej o handlu Forex/CFD na platformie Dukascopy Banku, rynku SWFX oraz innych rzeczy związanych z handlem,
zadzwoń do nas lub poproś o oddzwonienie.
zadzwoń do nas lub poproś o oddzwonienie.
For further information regarding potential cooperation,
please call us or make callback request.
please call us or make callback request.
Aby dowiedzieć się więcej o Opcjach Binarnych w Banku Dukascopy / platformach handlowych Forex, SWFX, oraz innych,
zadzwoń do nas lub pozostaw prośbę o oddzwonienie.
zadzwoń do nas lub pozostaw prośbę o oddzwonienie.
Aby dowiedzieć się więcej o handlu Forex/CFD na platformie Dukascopy Banku, rynku SWFX oraz innych rzeczy związanych z handlem,
zadzwoń do nas lub poproś o oddzwonienie.
zadzwoń do nas lub poproś o oddzwonienie.
To learn more about Crypto Trading / CFD / Forex trading platform, SWFX and other trading related information,
please call us or make callback request.
please call us or make callback request.
To learn more about Business Introducer and other trading related information,
please call us or make callback request.
please call us or make callback request.
For further information regarding potential cooperation,
please call us or make callback request.
please call us or make callback request.