Note: This section contains information in English only.
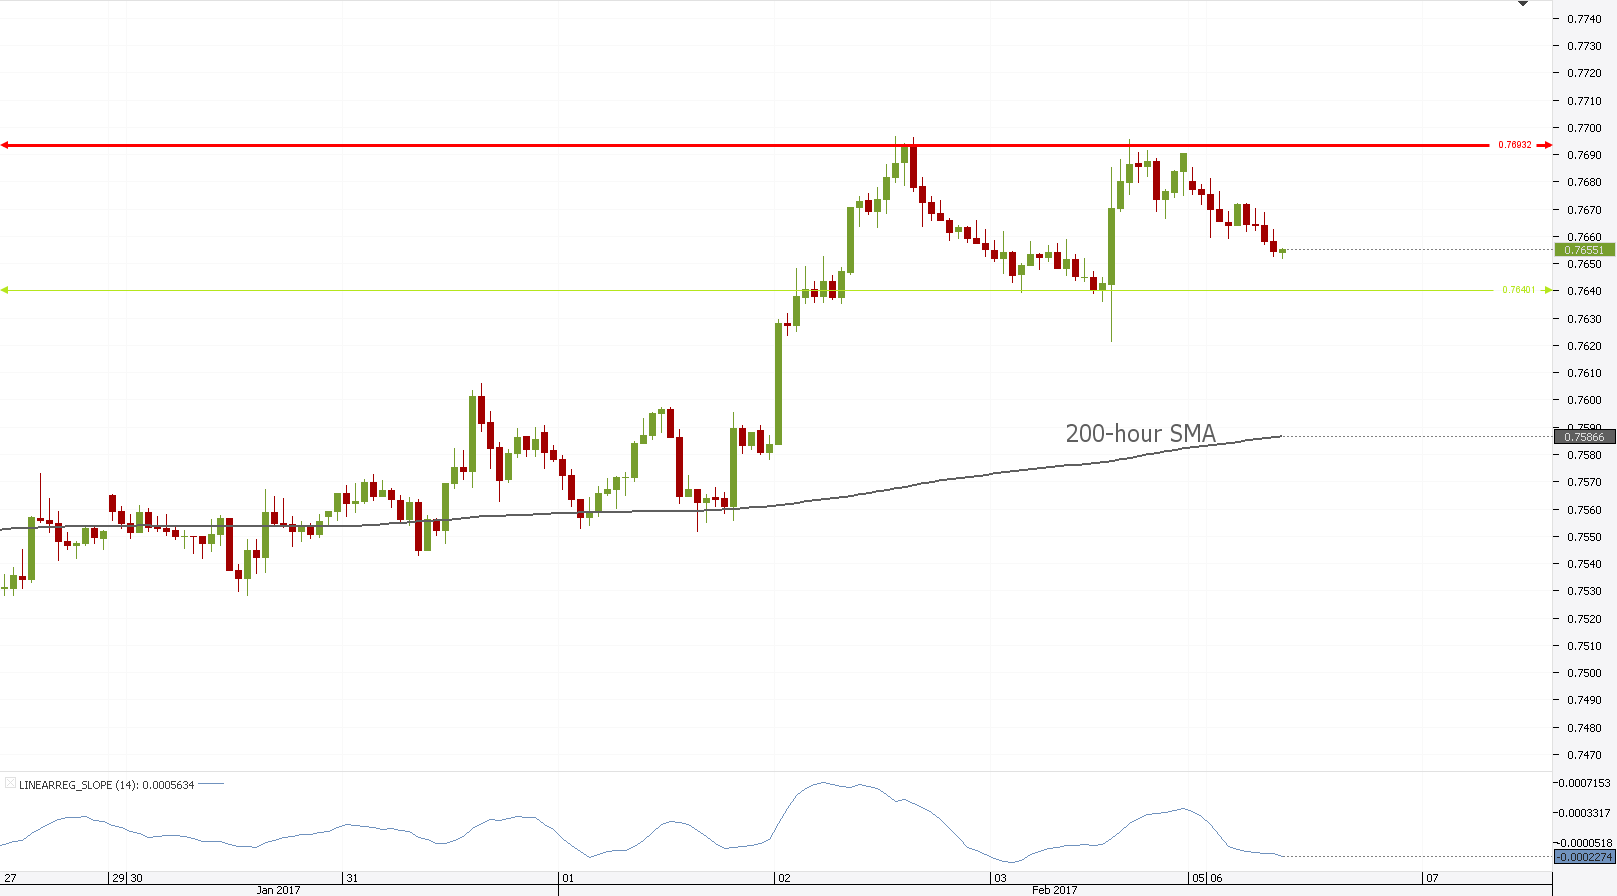
 AUD/USD showed a major dive over the last couple of months, but managed to recover and almost return to levels of before it broke a flattish ascending channel in November 2016. The pair is now, however, showing signs of weakness again with a double top formation on the hourly chart. The top lies at 0.7693, while the neck-line is located at 0.7640 and is the current ultimate target of the short-term downward motion. The neckline is strengthened by a green Ichimoku cloud and could cause some consolidation before it is broken.

Mon, 06 Feb 2017 09:24:35 GMT
Source: Dukascopy Bank SA
© Dukascopy Bank SA
© Dukascopy Bank SA
Actual Topics
Subscribe to "Fundamental Analysis" feed
Subscribe
To learn more about Dukascopy Bank CFD / Forex trading platform, SWFX and other trading related information,
please call us or make callback request.
please call us or make callback request.
For further information regarding potential cooperation,
please call us or make callback request.
please call us or make callback request.
To learn more about Dukascopy Bank Binary Options
/ Forex trading platform, SWFX and other trading related information,
please call us or make callback request.
please call us or make callback request.
Chcete-li se dozvědět více o platformě Dukascopy Bank CFD / Forex, SWFX a dalších souvisejících obchodních informacích, prosím, zavolejte nám, nebo vám můžeme zavolat my.
To learn more about Crypto Trading / CFD / Forex trading platform, SWFX and other trading related information,
please call us or make callback request.
please call us or make callback request.
To learn more about Business Introducer and other trading related information,
please call us or make callback request.
please call us or make callback request.
For further information regarding potential cooperation,
please call us or make callback request.
please call us or make callback request.