Note: This section contains information in English only.
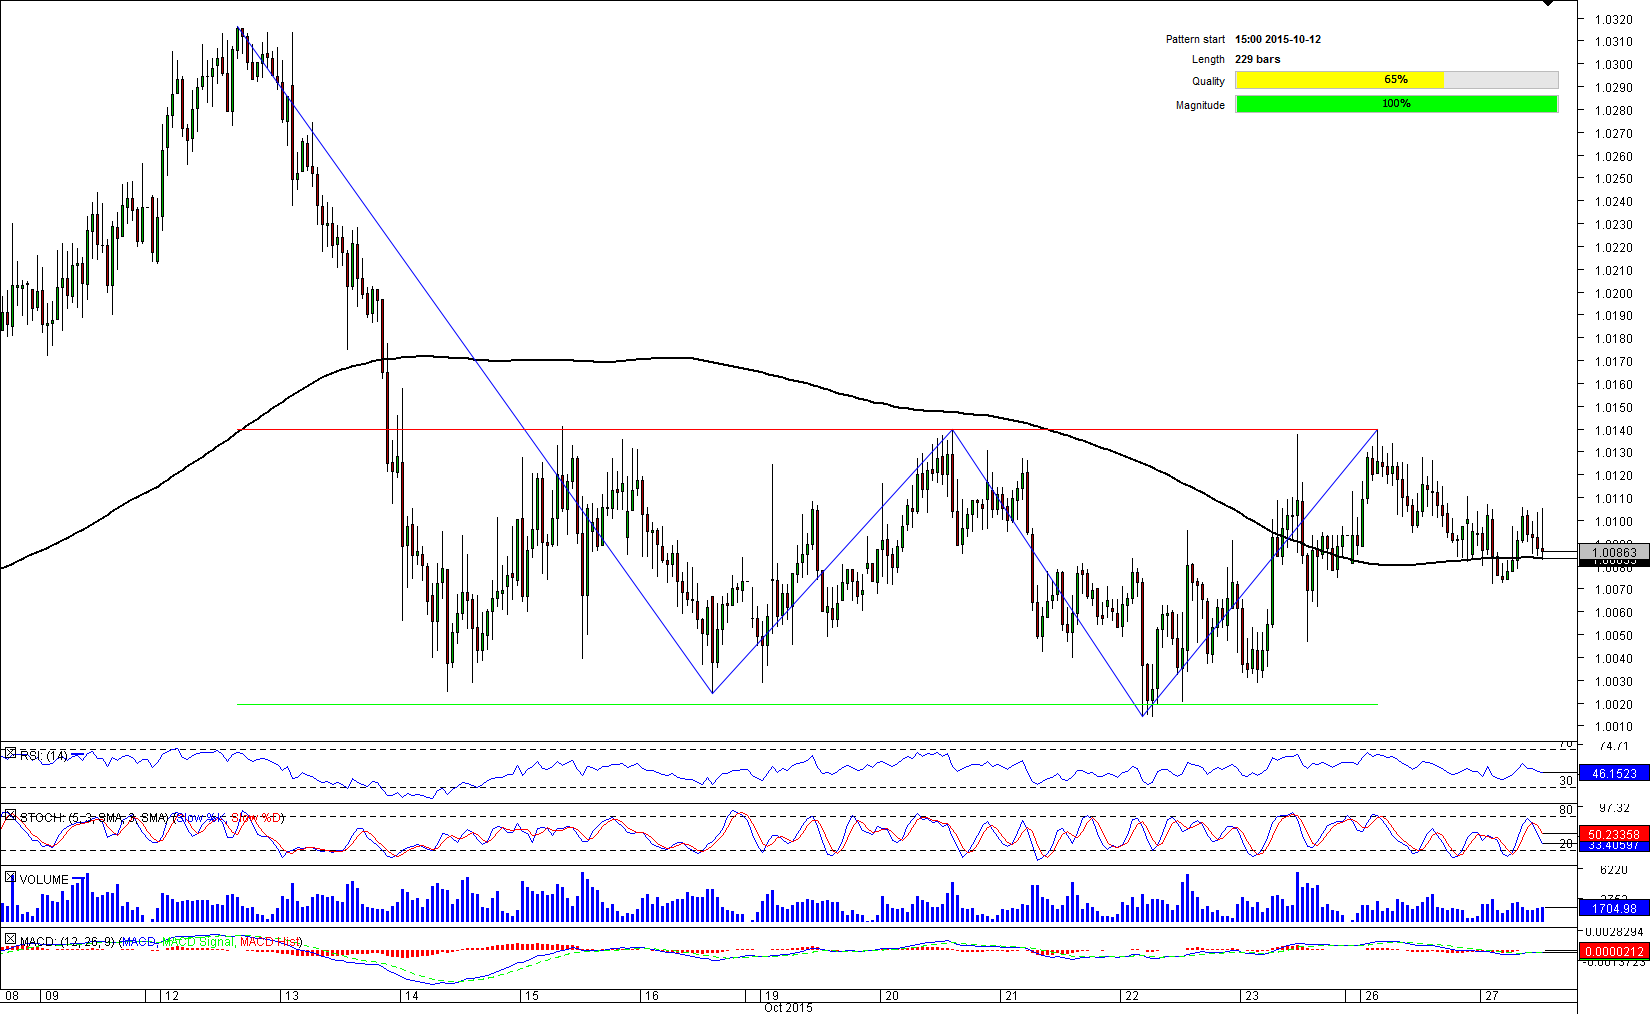
 AUD/SGD's sideways trading since October 14 resulted in the rectangle pattern, which emerged in one-hour chart for this currency pair. It touched the most recent high at 1.0139 yesterday and now there is time for a correction. The closest demand is represented by the weekly pivot point and 100/200-hour simple moving averages. They are able to delay the downward trend of the Aussie. On top of that, 72% of SWFX traders have bullish opinion with respect to AUD/SGD. Daily technicals, however, suggest a slump will eventually take place. Bears are aiming at the Oct 22 low (1.0013), but at first they will have to demonstrate the ability to violate the weekly S1 at 1.0024.

Tue, 27 Oct 2015 14:11:05 GMT
Source: Dukascopy Bank SA
© Dukascopy Bank SA
© Dukascopy Bank SA
Actual Topics
Subscribe to "Fundamental Analysis" feed
Subscribe
To learn more about Dukascopy Bank CFD / Forex trading platform, SWFX and other trading related information,
please call us or make callback request.
please call us or make callback request.
For further information regarding potential cooperation,
please call us or make callback request.
please call us or make callback request.
To learn more about Dukascopy Bank Binary Options
/ Forex trading platform, SWFX and other trading related information,
please call us or make callback request.
please call us or make callback request.
Chcete-li se dozvědět více o platformě Dukascopy Bank CFD / Forex, SWFX a dalších souvisejících obchodních informacích, prosím, zavolejte nám, nebo vám můžeme zavolat my.
To learn more about Crypto Trading / CFD / Forex trading platform, SWFX and other trading related information,
please call us or make callback request.
please call us or make callback request.
To learn more about Business Introducer and other trading related information,
please call us or make callback request.
please call us or make callback request.
For further information regarding potential cooperation,
please call us or make callback request.
please call us or make callback request.