Note: This section contains information in English only.
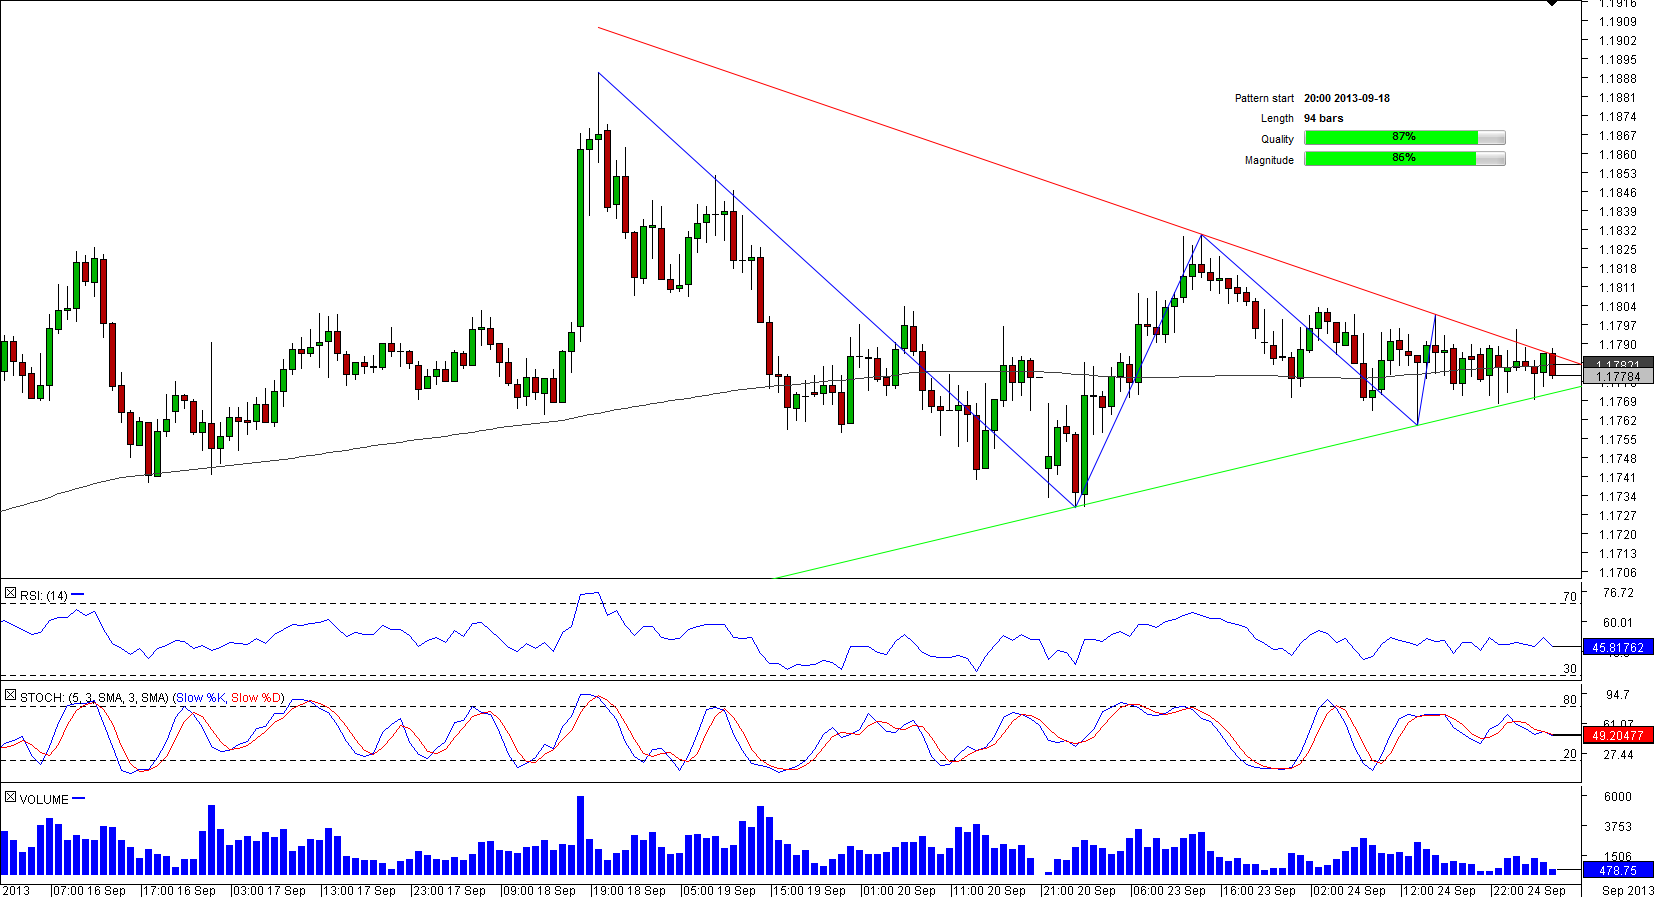
 During the past 100 bars the trading range of AUD/SGD has been generally contracting around the long-term moving average for 200 periods, resulting in the appearance of the symmetrical triangle on an hourly chart. Noteworthy is the fact that there is room only for a few bars to be formed until the apex of the pattern is reached, meaning the breakout may occur at any moment now.

Wed, 25 Sep 2013 07:26:50 GMT
Source: Dukascopy Bank SA
© Dukascopy Bank SA
Judging by the daily technical indicators, most of which are giving ‘buy' signals, the risks are skewed to the upside, but then the currency pair will have to overcome 1.1803 and 1.1824 on the way to the local high.
© Dukascopy Bank SA
Actual Topics
Subscribe to "Fundamental Analysis" feed
Subscribe
To learn more about Dukascopy Bank CFD / Forex trading platform, SWFX and other trading related information,
please call us or make callback request.
please call us or make callback request.
For further information regarding potential cooperation,
please call us or make callback request.
please call us or make callback request.
To learn more about Dukascopy Bank Binary Options
/ Forex trading platform, SWFX and other trading related information,
please call us or make callback request.
please call us or make callback request.
Chcete-li se dozvědět více o platformě Dukascopy Bank CFD / Forex, SWFX a dalších souvisejících obchodních informacích, prosím, zavolejte nám, nebo vám můžeme zavolat my.
To learn more about Crypto Trading / CFD / Forex trading platform, SWFX and other trading related information,
please call us or make callback request.
please call us or make callback request.
To learn more about Business Introducer and other trading related information,
please call us or make callback request.
please call us or make callback request.
For further information regarding potential cooperation,
please call us or make callback request.
please call us or make callback request.