Note: This section contains information in English only.
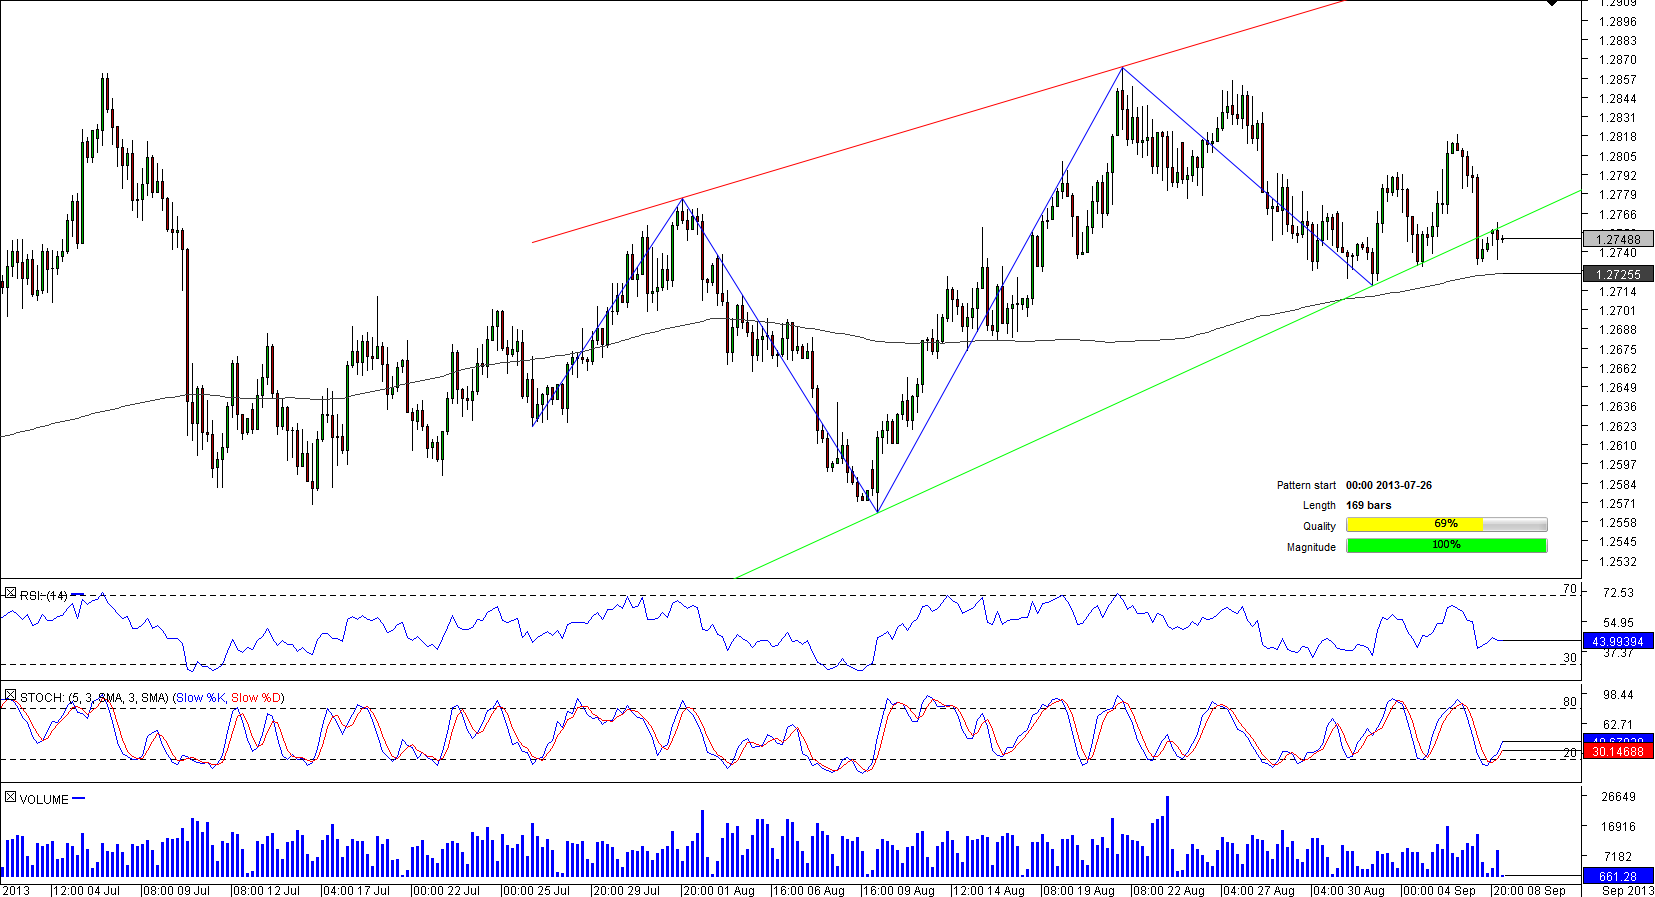
 USD/SGD started its upward trend on July 26, when the pair broke through its 200-bar SMA. The currency couple vacillated within a rising wedge pattern during the last six weeks until it successfully attempted to cross the lower boundary of the pattern on September 6; this move is likely to provoke a sharp depreciation of the pair in the days to come. USD/SGD may fall to its 200-bar SMA at 1.2725 that acts as a strong support level and, if overcome, may amplify the decline towards the next support zone at 1.2714 (daily S1) that may assuage selling pressure.

Mon, 09 Sep 2013 07:10:58 GMT
Source: Dukascopy Bank SA
© Dukascopy Bank SA
© Dukascopy Bank SA
Actual Topics
Subscribe to "Fundamental Analysis" feed
Subscribe
To learn more about Dukascopy Bank CFD / Forex trading platform, SWFX and other trading related information,
please call us or make callback request.
please call us or make callback request.
For further information regarding potential cooperation,
please call us or make callback request.
please call us or make callback request.
To learn more about Dukascopy Bank Binary Options
/ Forex trading platform, SWFX and other trading related information,
please call us or make callback request.
please call us or make callback request.
Chcete-li se dozvědět více o platformě Dukascopy Bank CFD / Forex, SWFX a dalších souvisejících obchodních informacích, prosím, zavolejte nám, nebo vám můžeme zavolat my.
To learn more about Crypto Trading / CFD / Forex trading platform, SWFX and other trading related information,
please call us or make callback request.
please call us or make callback request.
To learn more about Business Introducer and other trading related information,
please call us or make callback request.
please call us or make callback request.
For further information regarding potential cooperation,
please call us or make callback request.
please call us or make callback request.