Note: This section contains information in English only.
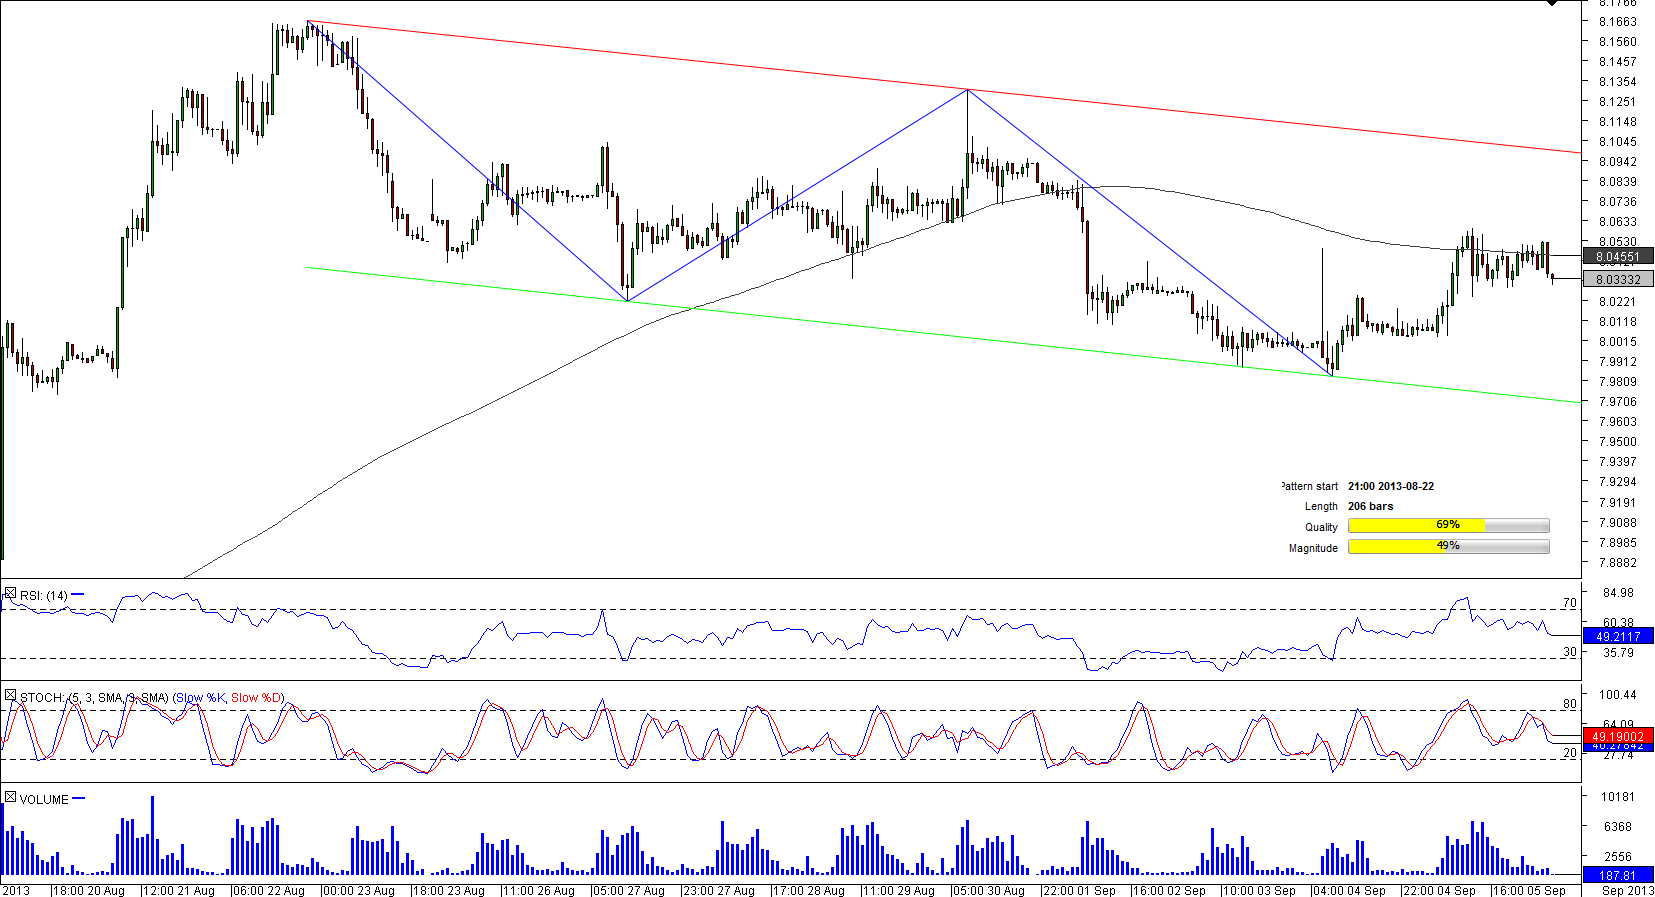
 A rise to the highest level since November 2010 on August 22 was the starting point for a channel down pattern, within which EUR/NOK was retreating until it hit a two-week low of 7.9843 on September 4 that prompted a slight appreciation towards its 200-hour SMA at 8.0423. However, the pair failed to break through its this level and now is trading under its daily pivot at 8.0367. A channel down is considered a bearish pattern, implying that a further drop is likely. To confirm this, EUR/NOK has to breach support levels at 8.0143 (daily S1) and 7.9814 (daily S2 and two-week low), the region regarded as the last defence for an accelerating decline to the pattern's support at 7.9843.

Fri, 06 Sep 2013 07:18:13 GMT
Source: Dukascopy Bank SA
© Dukascopy Bank SA
© Dukascopy Bank SA
Actual Topics
Subscribe to "Fundamental Analysis" feed
Subscribe
To learn more about Dukascopy Bank CFD / Forex trading platform, SWFX and other trading related information,
please call us or make callback request.
please call us or make callback request.
For further information regarding potential cooperation,
please call us or make callback request.
please call us or make callback request.
To learn more about Dukascopy Bank Binary Options
/ Forex trading platform, SWFX and other trading related information,
please call us or make callback request.
please call us or make callback request.
Chcete-li se dozvědět více o platformě Dukascopy Bank CFD / Forex, SWFX a dalších souvisejících obchodních informacích, prosím, zavolejte nám, nebo vám můžeme zavolat my.
To learn more about Crypto Trading / CFD / Forex trading platform, SWFX and other trading related information,
please call us or make callback request.
please call us or make callback request.
To learn more about Business Introducer and other trading related information,
please call us or make callback request.
please call us or make callback request.
For further information regarding potential cooperation,
please call us or make callback request.
please call us or make callback request.