Note: This section contains information in English only.


Fri, 23 Aug 2013 14:01:30 GMT
Source: Dukascopy Bank SA
© Dukascopy Bank SA
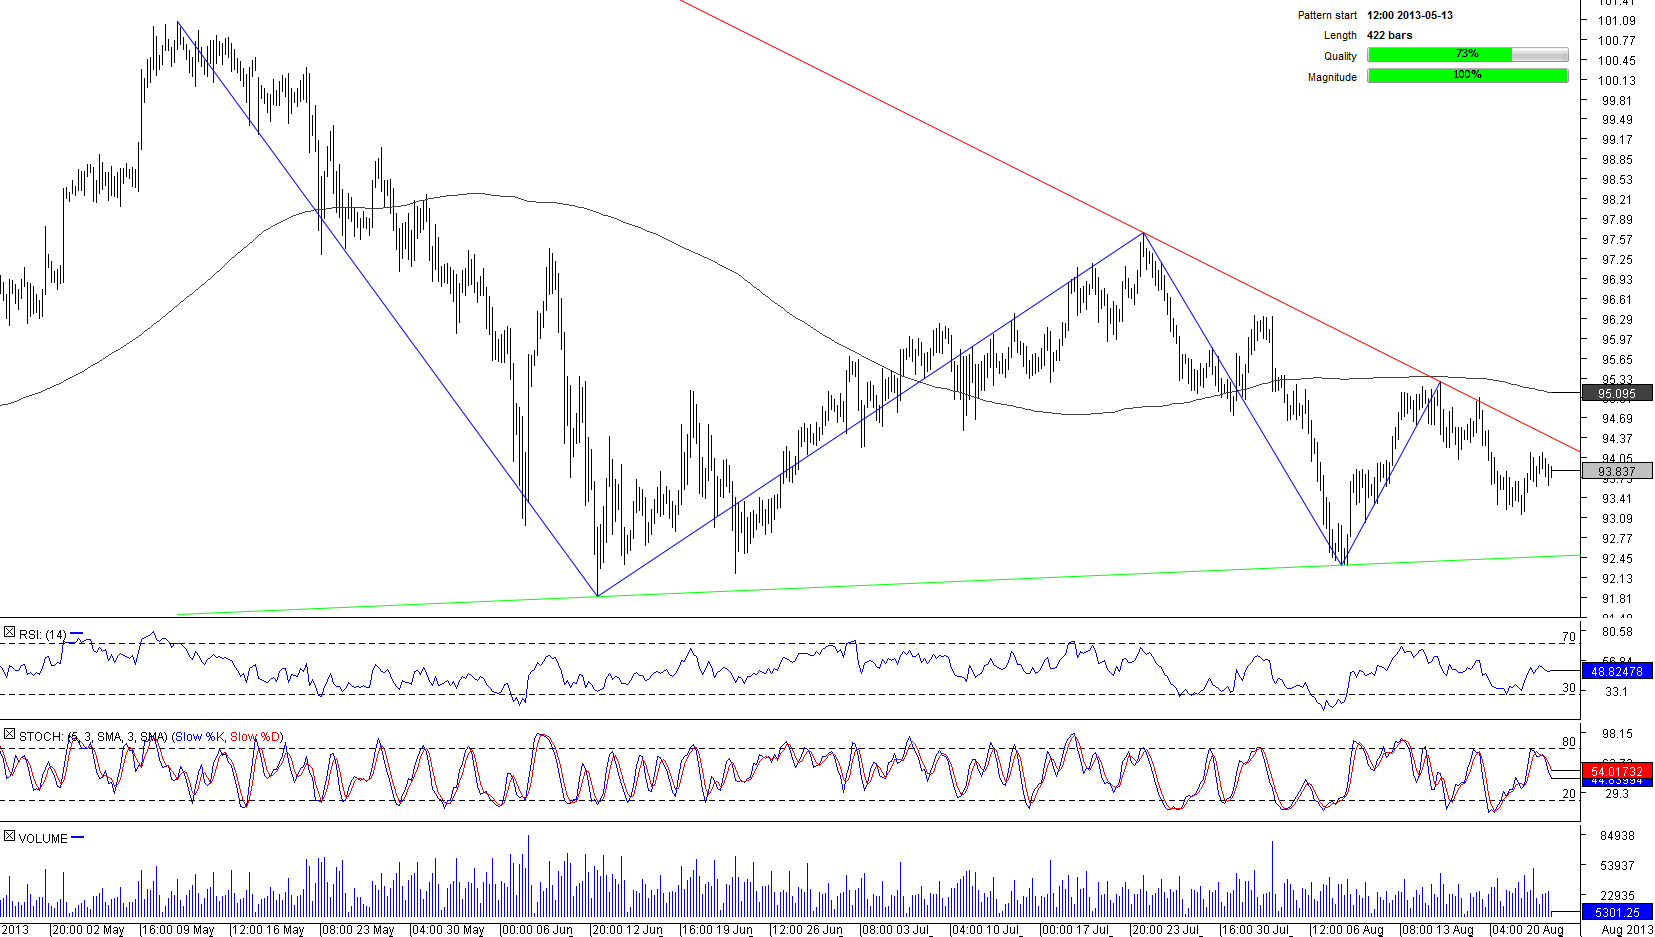
Pair has been narrowing its trading range for the past 3 months—from 900 pips in the middle of May to 200 pips in today. Pair is currently trading in the last fifth of the pattern, thus we are facing elevated probability of a break out. Since medium and long term technicals give opposite outlook from the short term technicals we could expect some increased volatility trading or an attempt to breach the through the pattern's resistance and a bearish pullback followed by eventual breakout through the pattern's support. On the other notion, it seems that Fibonacci retracements (13th of May till 13th of June move) are having significant impact on the pair.
© Dukascopy Bank SA
Actual Topics
Subscribe to "Fundamental Analysis" feed
Subscribe
To learn more about Dukascopy Bank CFD / Forex trading platform, SWFX and other trading related information,
please call us or make callback request.
please call us or make callback request.
For further information regarding potential cooperation,
please call us or make callback request.
please call us or make callback request.
To learn more about Dukascopy Bank Binary Options
/ Forex trading platform, SWFX and other trading related information,
please call us or make callback request.
please call us or make callback request.
Chcete-li se dozvědět více o platformě Dukascopy Bank CFD / Forex, SWFX a dalších souvisejících obchodních informacích, prosím, zavolejte nám, nebo vám můžeme zavolat my.
To learn more about Crypto Trading / CFD / Forex trading platform, SWFX and other trading related information,
please call us or make callback request.
please call us or make callback request.
To learn more about Business Introducer and other trading related information,
please call us or make callback request.
please call us or make callback request.
For further information regarding potential cooperation,
please call us or make callback request.
please call us or make callback request.