Note: This section contains information in English only.
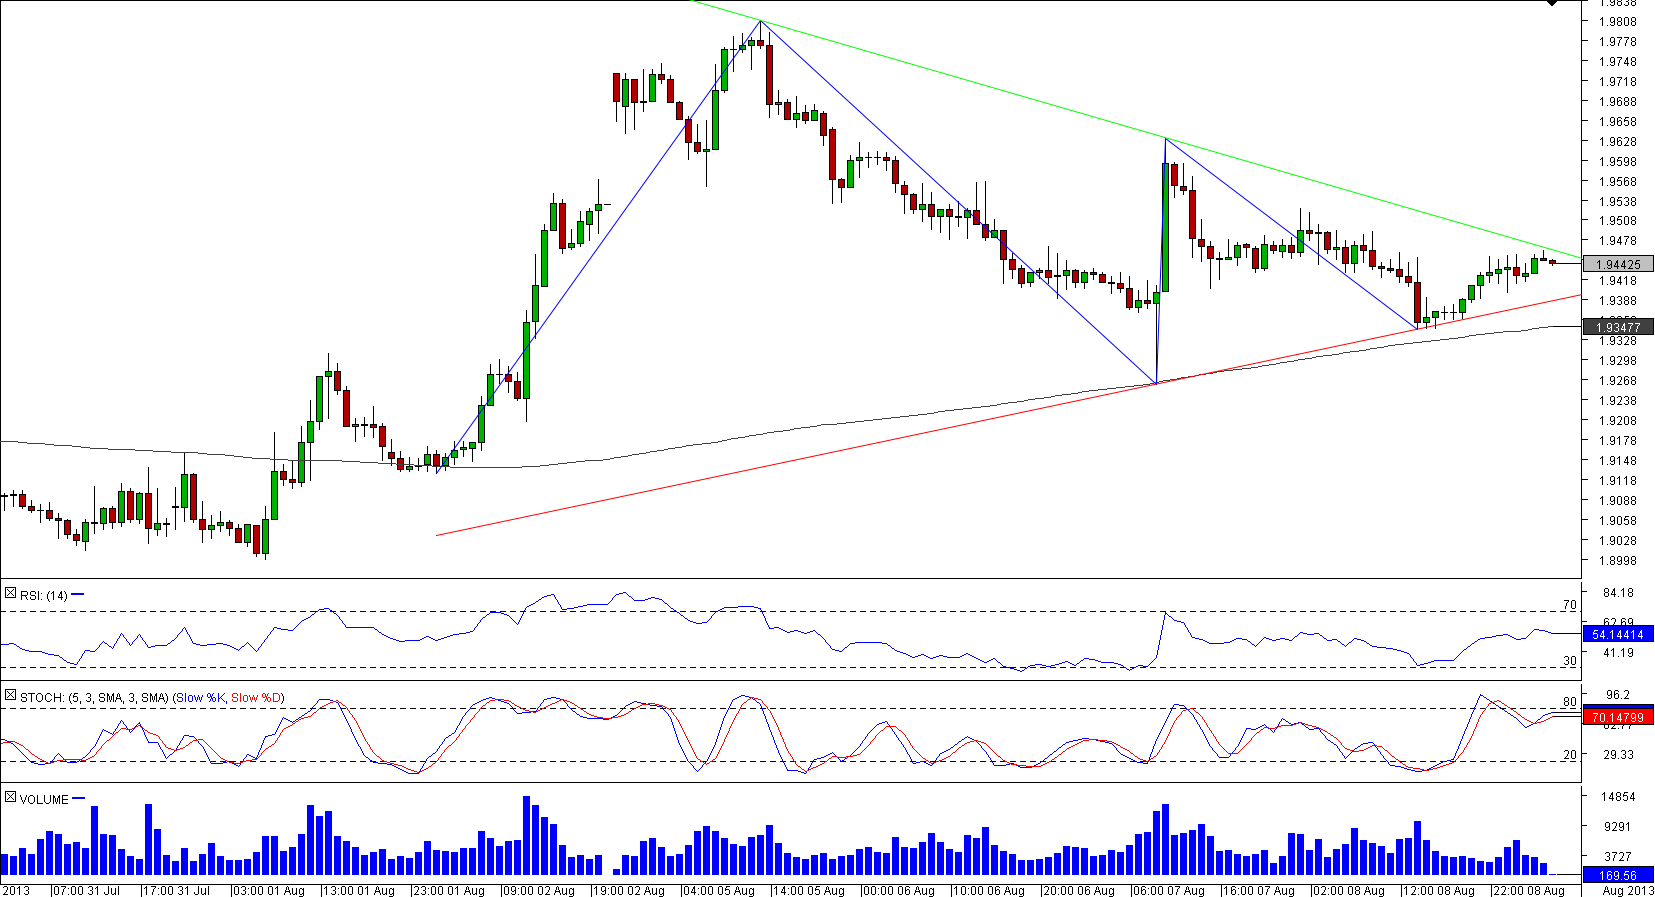
 Since the beginning of August the 200-hour simple moving average has successfully underpinned the currency pair and thereby preserved the bullish outlook. However, each subsequent peak GBP/NZD charted was lower than the previous one, resulting in a triangle being formed on an hourly chart.

Fri, 09 Aug 2013 06:27:31 GMT
Source: Dukascopy Bank SA
© Dukascopy Bank SA
The pair is already at the very end of the pattern, meaning the break-out is supposed to occur in the nearest future. Judging by the signals provided by the technical indicators and the assumption that the path of the least resistance is to the upside, a rally is considerably more probable than a dip.
© Dukascopy Bank SA
Actual Topics
Subscribe to "Fundamental Analysis" feed
Subscribe
To learn more about Dukascopy Bank CFD / Forex trading platform, SWFX and other trading related information,
please call us or make callback request.
please call us or make callback request.
For further information regarding potential cooperation,
please call us or make callback request.
please call us or make callback request.
To learn more about Dukascopy Bank Binary Options
/ Forex trading platform, SWFX and other trading related information,
please call us or make callback request.
please call us or make callback request.
Chcete-li se dozvědět více o platformě Dukascopy Bank CFD / Forex, SWFX a dalších souvisejících obchodních informacích, prosím, zavolejte nám, nebo vám můžeme zavolat my.
To learn more about Crypto Trading / CFD / Forex trading platform, SWFX and other trading related information,
please call us or make callback request.
please call us or make callback request.
To learn more about Business Introducer and other trading related information,
please call us or make callback request.
please call us or make callback request.
For further information regarding potential cooperation,
please call us or make callback request.
please call us or make callback request.