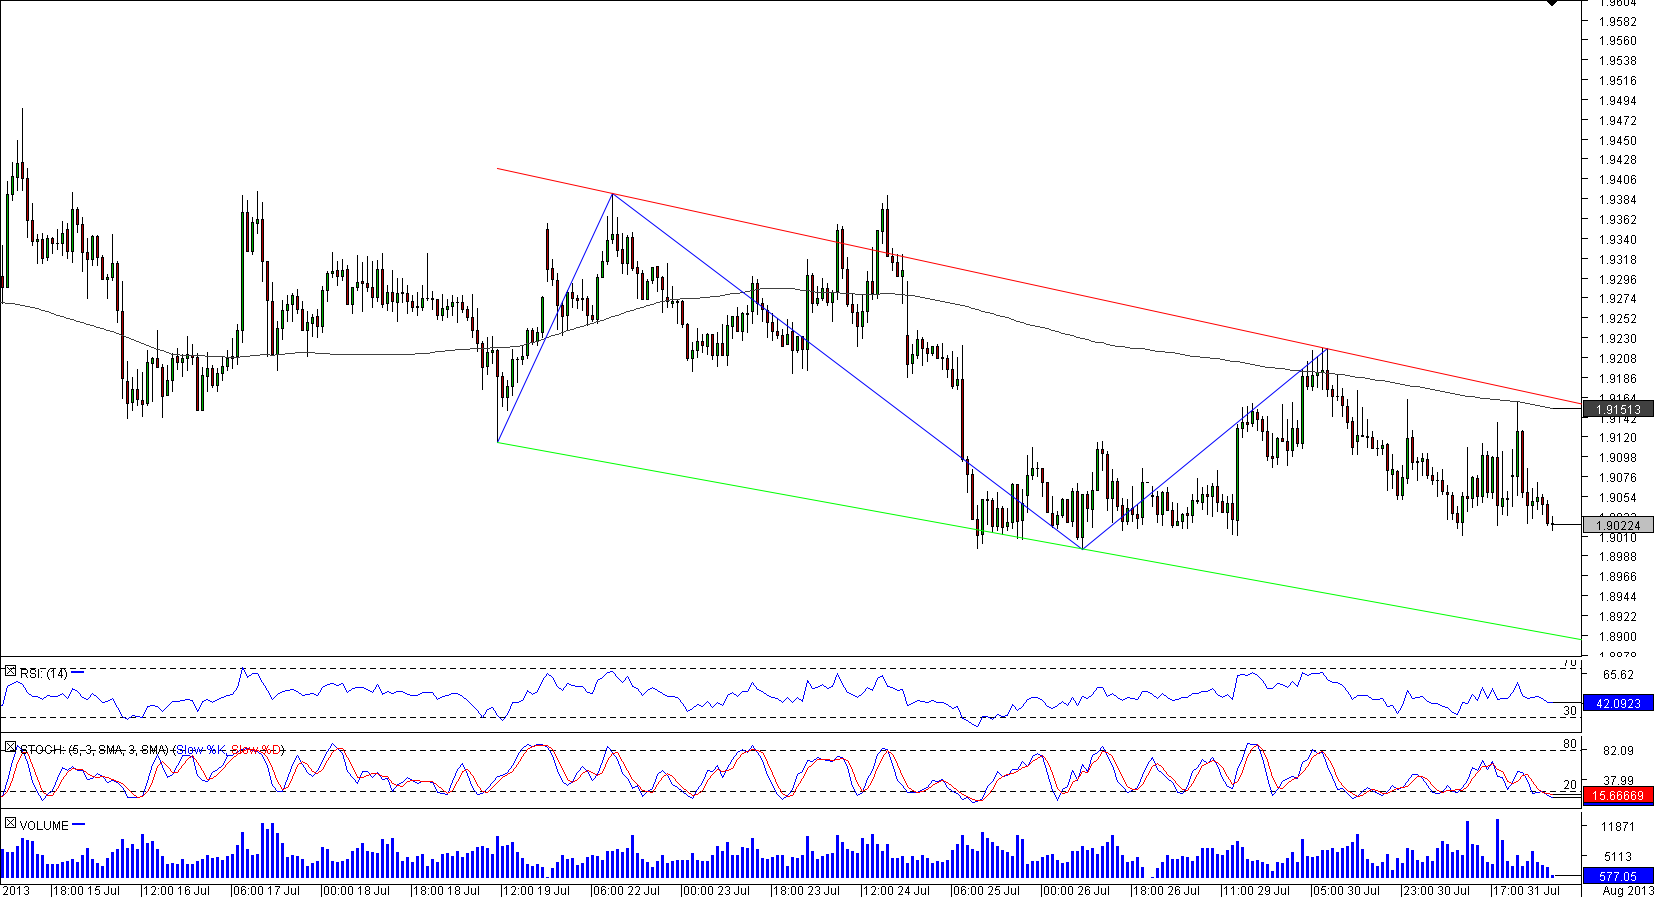
Despite the fact that the upper trend-line was breached once, the channel down on an hourly chart of GBP/NZD seems to be a reliable pattern. At the moment the major resistance is found at 1.9143, a cluster of various studies, including but not limited to the 200-hour SMA, daily R1 and a down-sloping line. Accordingly, we would expect this area to cap the price and guide it towards the lower edge of the pattern at 1.8895. This level is currently being guarded by the daily S1 and S2 at 1.8992 and 1.8926 respectively. In the meantime, technicals on all relevant time-frames are mixed.
Note: This section contains information in English only.


Thu, 01 Aug 2013 06:30:56 GMT
Source: Dukascopy Bank SA
© Dukascopy Bank SA
© Dukascopy Bank SA
Actual Topics
Subscribe to "Fundamental Analysis" feed
Subscribe
To learn more about Dukascopy Bank CFD / Forex trading platform, SWFX and other trading related information,
please call us or make callback request.
please call us or make callback request.
For further information regarding potential cooperation,
please call us or make callback request.
please call us or make callback request.
To learn more about Dukascopy Bank Binary Options
/ Forex trading platform, SWFX and other trading related information,
please call us or make callback request.
please call us or make callback request.
Chcete-li se dozvědět více o platformě Dukascopy Bank CFD / Forex, SWFX a dalších souvisejících obchodních informacích, prosím, zavolejte nám, nebo vám můžeme zavolat my.
To learn more about Crypto Trading / CFD / Forex trading platform, SWFX and other trading related information,
please call us or make callback request.
please call us or make callback request.
To learn more about Business Introducer and other trading related information,
please call us or make callback request.
please call us or make callback request.
For further information regarding potential cooperation,
please call us or make callback request.
please call us or make callback request.