Note: This section contains information in English only.
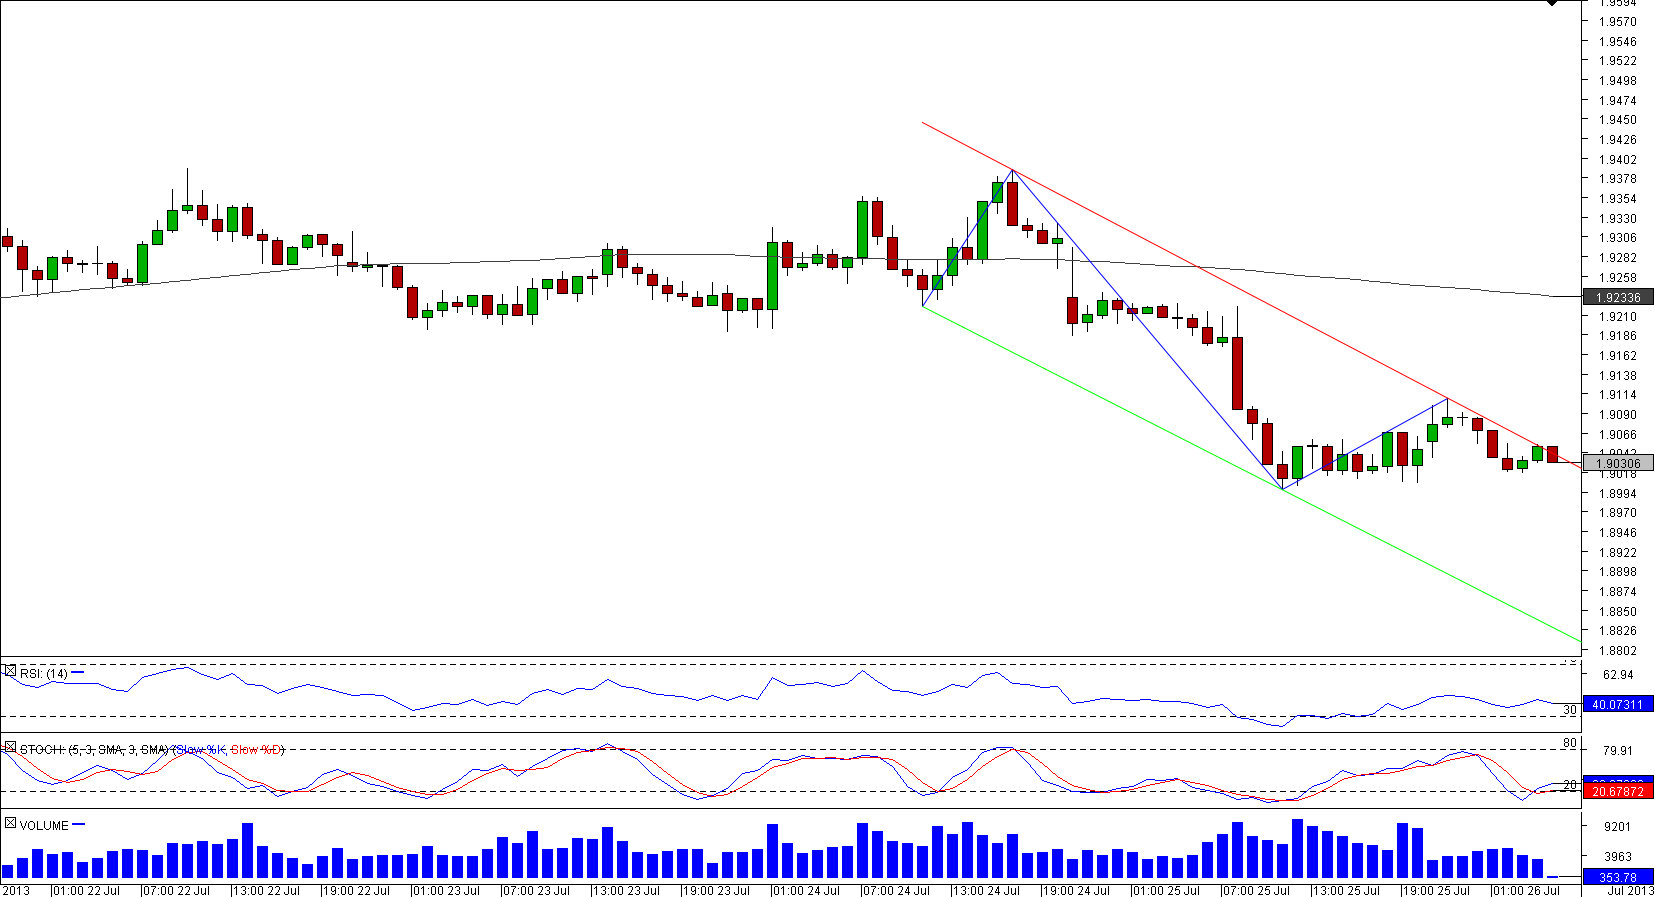
 There is a channel down pattern emerging on an hourly chart of GBP/NZD currency pair. After trading sideways for some time, the pair has finally decoupled from the 200-hour SMA, which it has been gravitating to for more than 200 hours. Now GBP/NZD is testing the potential upper boundary of the downward-sloping corridor at 1.6045, which should remain intact in order for the formation to be validated. If this is the case, then the supports that are likely to be encountered in the nearest future are the daily S1 and S2 at 1.8977 and 1.8870 respectively, while the falling trend-line at 1.8811 is expected to initiate a bullish correction.

Fri, 26 Jul 2013 07:15:21 GMT
Source: Dukascopy Bank SA
© Dukascopy Bank SA
© Dukascopy Bank SA
Actual Topics
Subscribe to "Fundamental Analysis" feed
Subscribe
To learn more about Dukascopy Bank CFD / Forex trading platform, SWFX and other trading related information,
please call us or make callback request.
please call us or make callback request.
For further information regarding potential cooperation,
please call us or make callback request.
please call us or make callback request.
To learn more about Dukascopy Bank Binary Options
/ Forex trading platform, SWFX and other trading related information,
please call us or make callback request.
please call us or make callback request.
Chcete-li se dozvědět více o platformě Dukascopy Bank CFD / Forex, SWFX a dalších souvisejících obchodních informacích, prosím, zavolejte nám, nebo vám můžeme zavolat my.
To learn more about Crypto Trading / CFD / Forex trading platform, SWFX and other trading related information,
please call us or make callback request.
please call us or make callback request.
To learn more about Business Introducer and other trading related information,
please call us or make callback request.
please call us or make callback request.
For further information regarding potential cooperation,
please call us or make callback request.
please call us or make callback request.