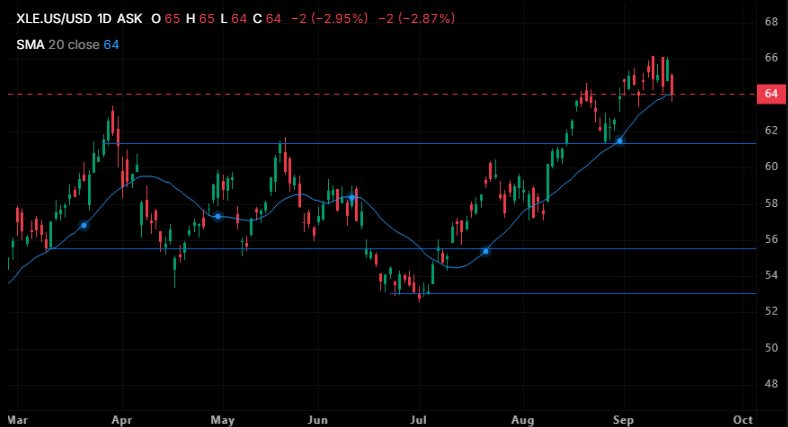
- Macro Structure: Bullish continuation intact above higher lows, with the September rally peaking at the $66.00–$66.50 resistance zone.
- Immediate Pivot: The rising 20-day SMA at $64.00 serves as dynamic line-in-the-sand support; holding it keeps upside momentum toward $66.50+ alive.
- Downside Risk: A decisive daily close below $64.00 exposes the previous breakout base and horizontal support cluster at $61.00–$61.50.
- Key Ceiling: A sustained push beyond $66.50 is required to resume the primary uptrend and open the path toward the $68.00 psychological barrier.
Note: This section contains information in English only.XLE remains in a multi-month uptrend established from its July double bottom near $53.00, but it is currently undergoing an active corrective pullback after stalling below resistance at $66.50. The latest sharp sell-off brings the price down nearly 3% to test the rising 20-day SMA at $64.00, marking a critical inflection point where a bounce preserves the near-term bullish trajectory, while a confirmed daily close beneath this moving average would signal deeper mean-reversion toward key horizontal support.
Thu, 17 Sep 2026 08:55:04 GMT
Source: Dukascopy Bank SA